Author: numeroteca
European Future Flag
Europa 2013
These are a series of posts thinking about the future of Europe in relation to the economic and financial crisis.
PageOneX, ready steady go!
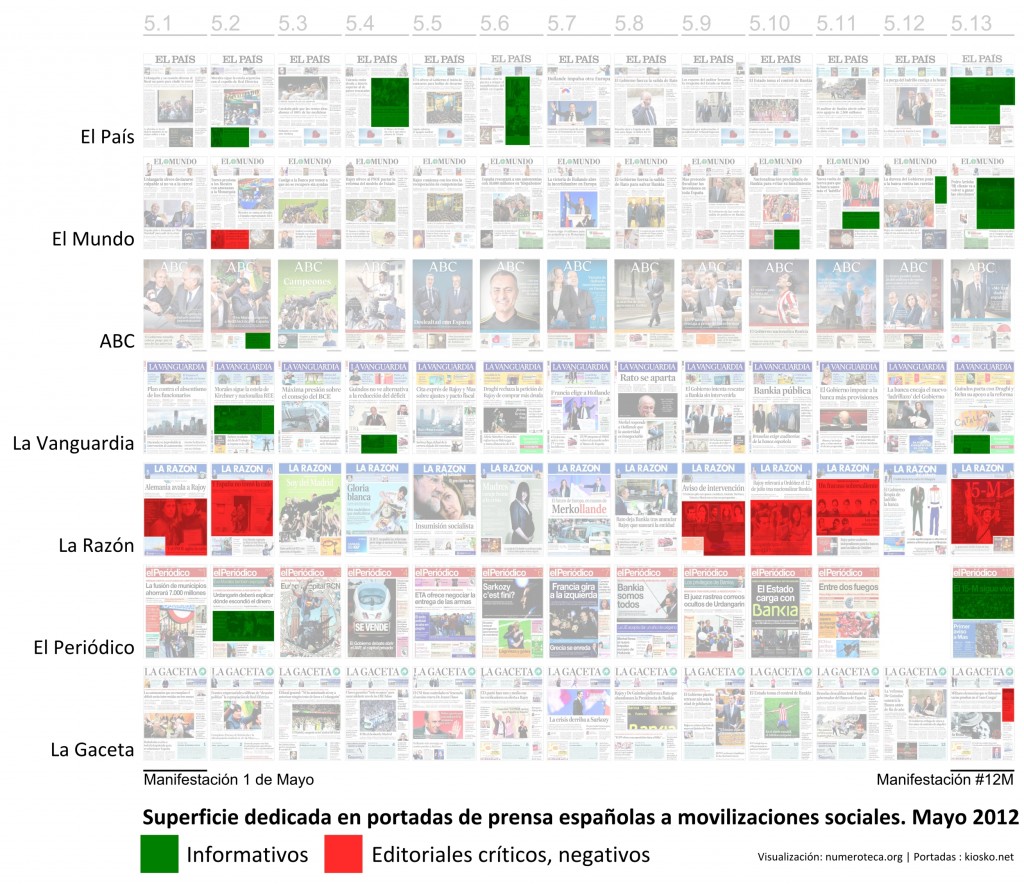
View this datavis full size at gigapan and the related post about May 2012 social mobilizations in Spain.
Today’s post is to present the tool we are building this summer: PageOneX. The idea behind is to make online and easier the coding process of front page newspapers. Make this visualization process available for researchers, advocacy groups and anyone interested. I’ll will give some background about this process.
How things started
Approximately one year ago I started diving in the front page world. It was days after the occupations of squares in many cities from Spain, and I was living in Boston. I made a front page visualization to show what people was talking about: the blackout in the media about the indignados #15M movement. You can read more about Cthe story in the ivic Media blog. Since then I’ve been making more visualizations around front pages of paper newspapers, testing different methods and possible ways to use them. I’ve also made a tool, built in Processing, to scrap front pages from kiosko.net and build a .svg matrix.
- Gallery of different twitter-newspaper visualizations. https://numeroteca.org/cat/frontpage-newspaper/
- Post: Analyzing newspapers’ front pages to interpret the Mainstream Media ecology.
http://civic.mit.edu/blog/pablo/analyzing-newspapers-front-pages - Presentation: Approach to a User interface. http://www.slideshare.net/numeroteca/arab-spring-spanish-recolution-and-occupy-movement-mainstream-media-vs-social-media-coverage and more presentations at http://www.slideshare.net/numeroteca
- Code for the semi-automated process built in Processing: https://github.com/numeroteca/pageonex-processing
https://github.com/numeroteca/PageOneX
PageOneX: first tool
Before starting with the new tool, I’d like to present the present one I’ve been using this past moths: a semi-automated process with Processing and Inkscape. The code is available at https://github.com/numeroteca/pageonex-processing https://github.com/numeroteca/PageOneX.
The process is segmented in two main actions: 1. Get the front pages and 2. Code articles.
- Get the front pages
Open the pageonex.pde file and open it in Processing:- Select newspapers and starting and end dates (be aware of adjusting the size of the newspaper)
- Run the program to scrape front pages from kiosko.net. It automatically downloads them.
- It will construct the matrix of front pages in a .svg (Scalable Vector Graphics) file.
- Code articles
- Open the matrix.svg in Inkscape. It is a file with 3 layers:
- Highlights (multiply option to show transparency)
- Filter to make images look lighter.
- Images of front pages.
- Now highlight by hand the news we want by drawing rectangles (merging of rectangles for news with non-rectangular shapes) on the news.
- Export the file to a pretty .png file
- Open the matrix.svg in Inkscape. It is a file with 3 layers:
That was the process until now. It works, but it is not easy for not tech savy people: you need to have Processing installed, change the parameters and be able to ‘play’ with Inkscape at an intermediate level. That is how we decided to make this tool online, to broaden its use.
PageOneX.com
PageOneX.com (now temporary redirected to this blog) is an online platform for analyzing and visualizing coverage of news in newspapers’ front pages. We’ll be coding this summer to have at least a part of the tool available by August-September. We’ll be having some beta tests, so if you are interested, just ask for it! The idea is to open a co-design process where future users take part in the design of the tool.
Why analyzing front pages? Some ideas behind the project:
It seems that analyzing front pages is a good method, a shortcut to follow how news are being covered in the media. Front pages are a very special piece of the media ecology: newsrooms spend a lot of time deciding what goes in their A1, fighting which news have to be in their page one.
With this kind of visualizations we are able to show the data and the analysis at the same time. We can show in a bar chart quantitative data regarding the coverage, but also the data source it self: the front pages. We want to offer a visual and direct way to visualize all the coding. Check the The Global Media Monitoring Project Report methodology to see which other interesting approaches to this coding process. We have tested with Gigapan the possibility of exploring this huge graphics, to be able to read the newspapers and also have a sense of the whole data visualization.
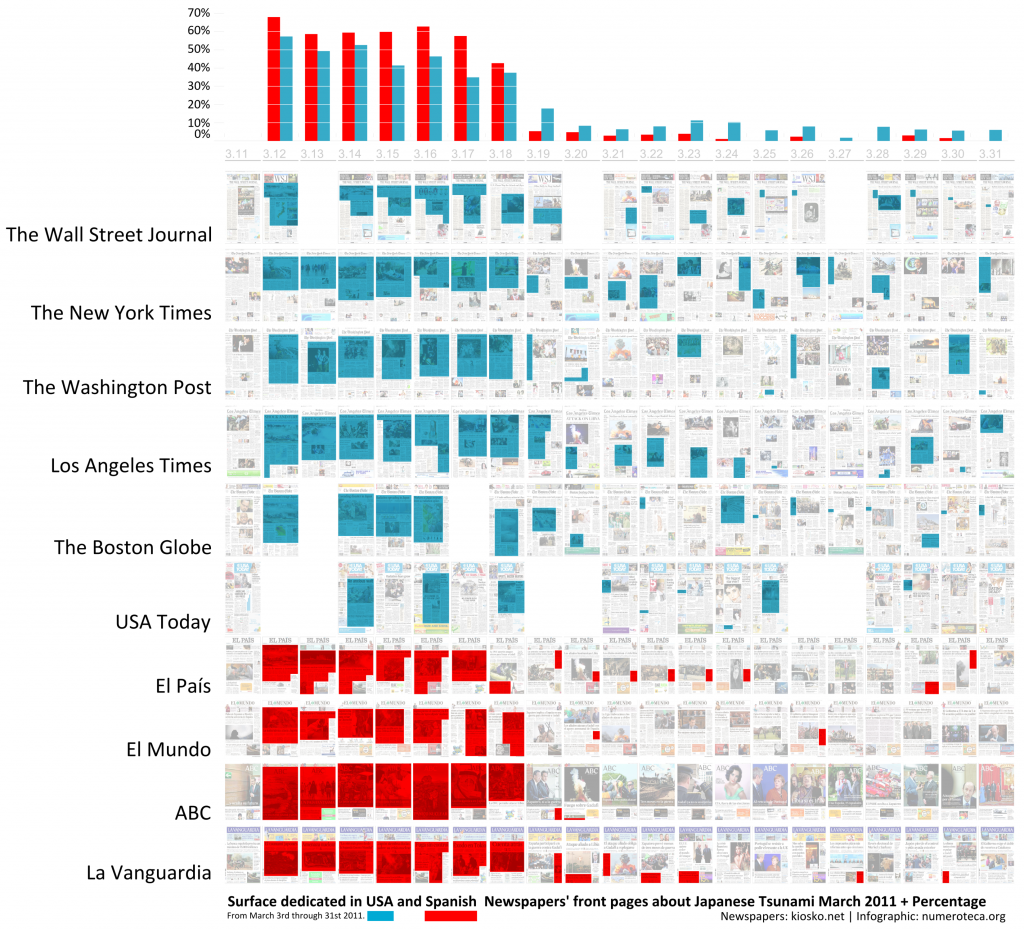
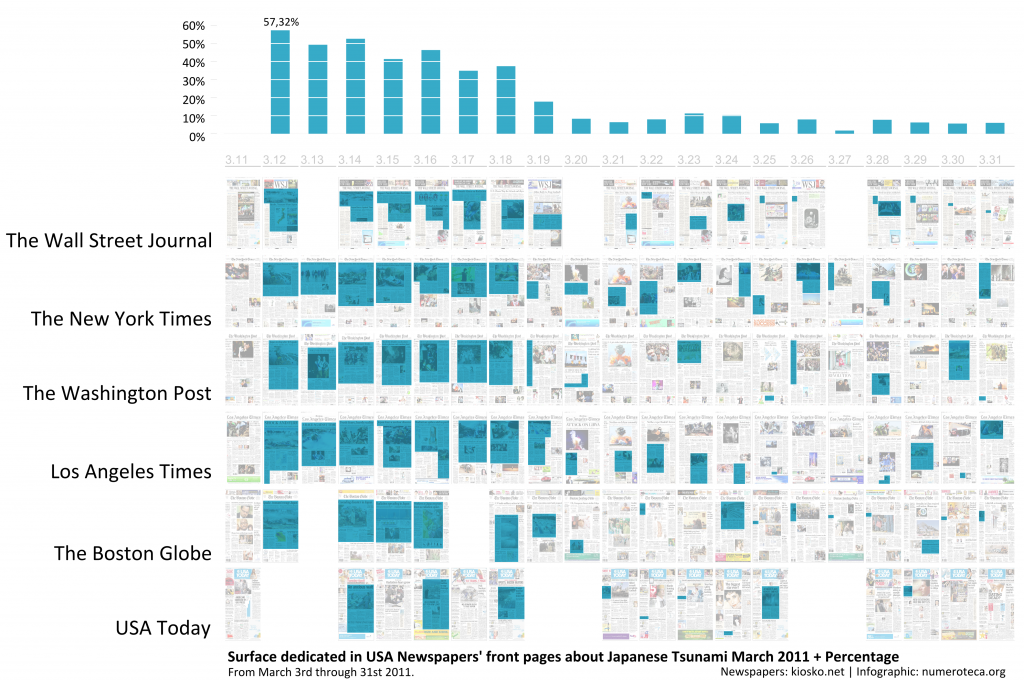
We’ll be using the percentage of every front page, instead of the actual size: it will allow us to compare newspapers with diferent sizes as we did with this example of US and Spanish newspapers covering the Japanese Tsunami in 2011.
Here there are slides about the project and basic draft for the User Interface.
Arab Spring, Spanish Revolution, and Occupy Movement: Mainstream Media vs Social Media coverage
The project is incorporating new collaborators: Ahmd Refat as coder, thanks to the Google Summer of Code programm; Sasha Costanza-Chock and Nathan Mathias from the Center for Civic Media at MIT Media Lab. Nathan is developing is also developing Mediameter with more people at the Center for Civic Media, we might be using their framework to build our tool and not start from scratch. Mediameter is used for crowd-source analysis of articles. We are also looking at Mapmill by Jeff Warren, built in Ruby on Rails, as it is a system to code image as well.
Stay tuned!
Cross posting visiting airplane cemetery in Tucson
On Tuesday we were at AMARG, the airplane cemetery in Tucson, Arizona USA.
Check other posts:
- At 6000km.org Visita al cementerio de aviones militares de Tucson, Arizona
- At Basurama.org/blog De Palermo, Italia a la Universidad de Palermo, Argentina thinking about a communication strategy for a multiformat delocalized collective (in Spanish).
Portadología
Últimamente no paro de ver artículos y posts sobre portadas de prensa:
- Concurso de belleza patriótica entre tabloides nacionalistas en paperpapers
- Me sube la rojigualdina por Javier Vizcaino
- Periodismo de ficción en guerraeterna
y especial mención para… - Crece en España la indignación por la «prima de riesgo mediática» en ABC (de donde saco la imagen de más arriba)
Creo que el tema se merece un análisis sobre la cirsis española en la prensa internacional y/o uno sobre españolidad en las portadas de La Razón vs. ABC.
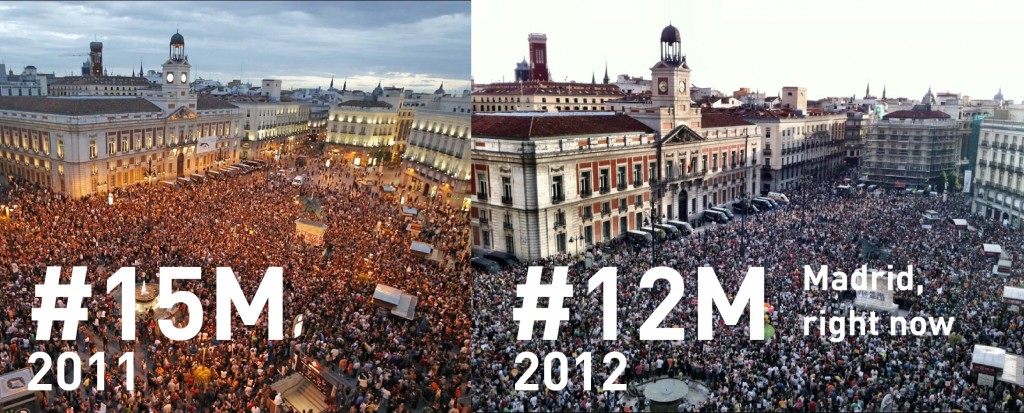
Las portadas del #12M15M: silencios y gritos
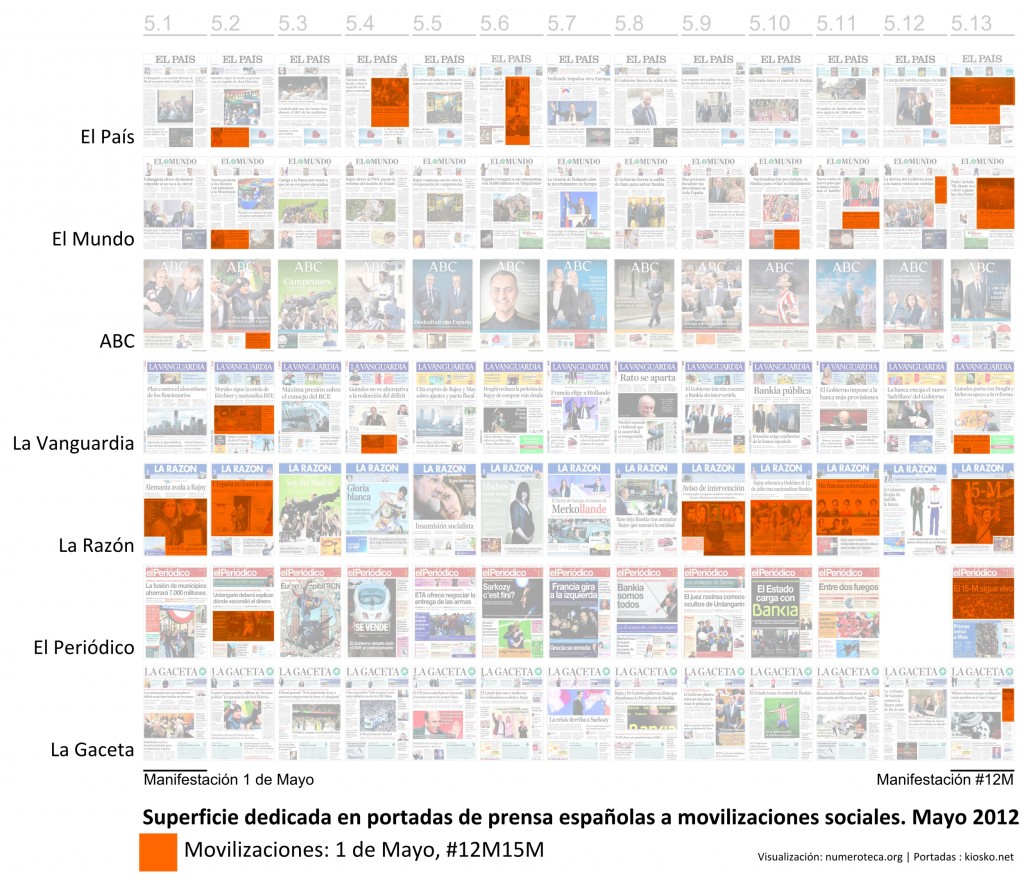
Hace un año fuimos actualizando el seguimiento de la prensa sobre el #15M a medida que pasaban los días. Aquí presentamos el gráfico actualizado del pasado domingo a día 16 de mayo. Tras el día 14 de mayo El País no ha vuelto a publicar nada en su portada sobre el tema, mientras que La Razón, El Mundo y La Gaceta han publicado noticias o editoriales negativas sobre el #15M. El ABC mantiene su silencio.
En en este segundo gráfico volvemos a diferenciar en dos colores diferentes para entender de qué están halando las portadas de un solo vistazo:
- verde: noticias informativas (valga la redundancia)
- rojo: noticias-editoriales de caracter negativo sobre las movilizaciones
Sin embargo, aunque desde el lunes el #15M no apareció en la portada de El País en papel y perdió su lugar prominente en la portada digital sí que mantuvo su cobertura en streaming durante los cuatro días ¿decisión editorial? Lo bueno es que ahora El País permite navegar por sus portadas digitales a través de su hemeroteca. Por otro lado, y basado en lo que fui ojeando, todos los periódicos cubrieron en sus versiones digitales las diferentes movilizaciones, principalmente las de Madrid y Barcelona.
En cualquier caso es reseñable cómo La Razón ha mantenido su dedicación a las movilizaciones y cómo ha sido especialemente insistente en el uso de la marca “15-M” para atraer la atención. Esto me recuerda a Intereconomía, que parece que aumentó su audiencia el pasado #15M gracias a su especial cobertura del evento.
Aquí los recortes de las portadas de La Razón del 13 al 16 de mayo de 2012 en donde aparece 15-M. Creatividad al poder.


Social media /Redes sociales en Internet
Hace un año añadimos el seguimiento en Twitter para comparar la influencia-repercusión en los ‘mass media” y en los ‘social media’. Ahora hemos usado diferentes métodos de captura de datos por Twitter y estamos comparándolos. Pronto compartiremos los resultados y los integraremos en este gráfico. De momento puedes seguir aquí los resultados preliminares: #12m15m.
Las portadas de mayo, del 1 de mayo al #12M15M
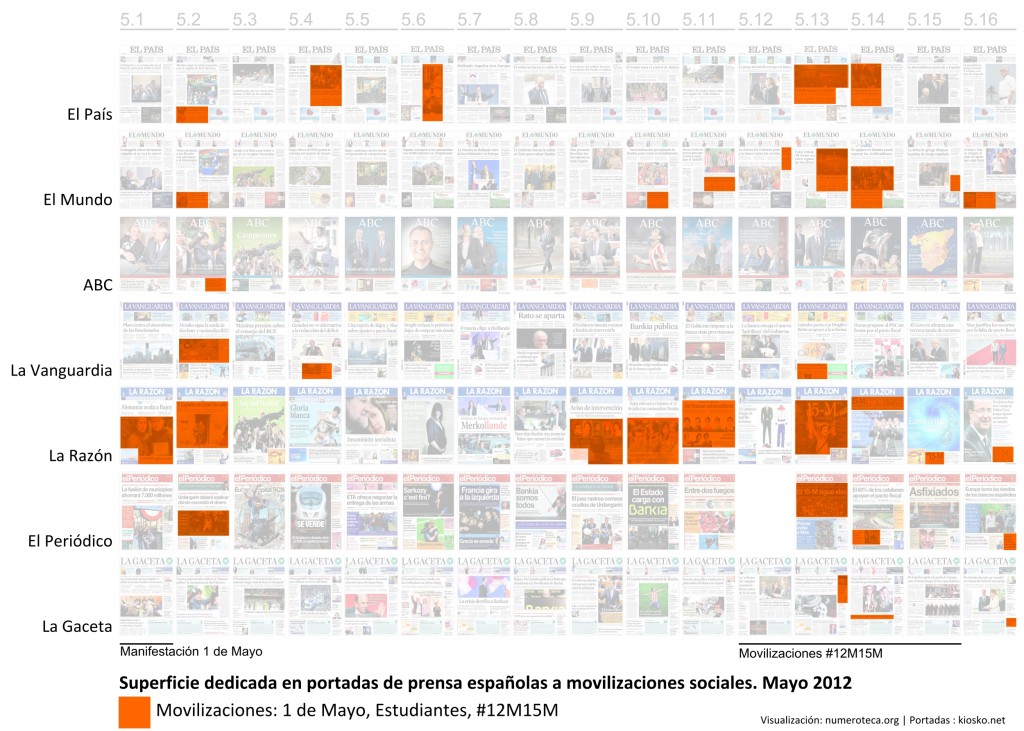
En las portadas de la prensa española se está reflejando de muy diferente forma las movilizaciones sociales. En el caso del mes de mayo hemos tenido el primero de mayo, movilizaciones estudiantiles y el #12m15m (aniversario del #15M). He recopilado aquí la superficie que han dedicado en sus portadas los diferentes periódicos. La visualización parece confirmar el análisis de Sáenz de Hugarte: la estrategia de La Razón es la de configurarse como un actor (a la contra) en el debate sobre las movilizaciones -y de paso llevarse unos Trending Topics-, mientras que el ABC opta por obviarlas. El País y El Mundo tienen un seguimiento similar, a ver qué pasa en los siguientes días.
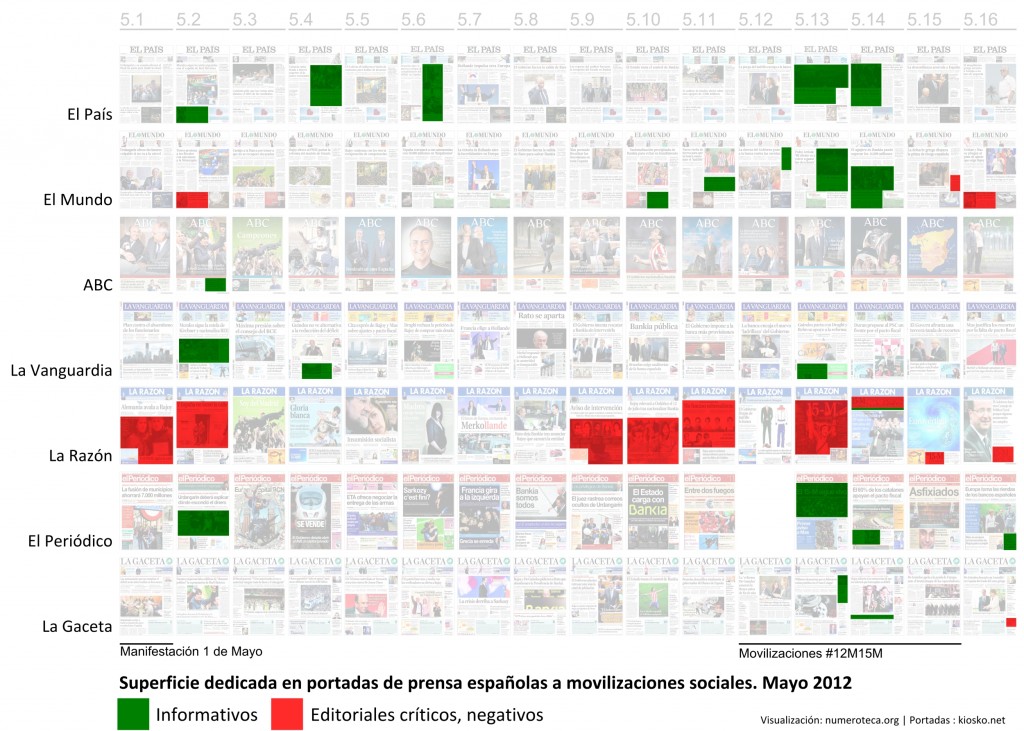
En el segundo gráfico diferencio qué es lo que se dice en cada una de esas portadas. Lo he dividido en dos grandes apartados:
- verde: noticias informativas (valga la redundancia)
- rojo: noticias-editoriales de caracter negativo sobre las movilizaciones
Manual #12M15M online para los que estamos fuera #12m15mdigital
Having fun creating some memes-like at @acampadaboston
Un año después, el #12M nos pilla más preparados para la acción que el #15M de 2011. Madrilonia y Stéphane M. Grueso han publicado sendos manuales/listas de consejos para los próximos días #12M15M, también puedes consultar incluso una guía para montar revoluciones. Para los que estamos fuera del país, y no tenemos ninguna movilización organizada cerca (ni hemos montado una propia) vamos a recopilar aquí algunas cosas que se pueden hacer. Anímate a comentar para completar esta lista.
- Júntate con otros, muestra tu apoyo en público y publica las fotos. Otros agradecerán las muestras de solidaridad. ¿Dónde publicar las fotos-vídeos? Donde sea, pero que sea online: etíquetalos con #12M15M en twitter, envíalos por email,
- ¿Cómo estar informado? Además de los medios de comunicación tradicionales puedes recurrir a las redes sociales on line, para saber lo que está pasando. Las redes más usadas actualmente son Facebook y Twitter. No hace falta tener una cuenta en ellas para poder acceder a la información.
- Twitter: Sigue el hashtag #12M15M (la forma de etiquetar un mensaje en Twitter) o sigue otros hashtags que se estén usando en ese momento, por ejemplo #yovoy12m #volvemos12m #acampadasol y muchos más que surgirán estos días. Cambiar el hashtag permite ser más visible en Twitter.
También puedes seguir lo que publican cuentas específicas como @12m_15m, @acampadasol o @acampadabcn entre muchas otras.
Exiten herramientas online para seguir la cantidad de tweets de ciertos hashtags. Topsy te permite ver además qué links la gente está compartiendo más en esos hashtags. Muy útil para encontrar la información más relevante, o al menos la más twiteada. - Facebook: Sigue las páginas de Fecebook de las diferentes organizaciones/plataformas como Democracia Real Ya, Acampadasol, Take the Square
- Vídeo streaming: Mucha gente estará retransmitiendo en directo lo que ocurre en las marchas y movilizaciones desde sus teléfonos móviles. Busca en Twitter “#12m15m video, “#12m15m streaming” o cosas similares para encontrar quién está retransmitiendo en ese momento. Para el caso de Madrid hay organizado un sistema de streaming vía Bambuser
http://bambuser.com/channel/peoplewitness.madridnorte sur este y oeste - Webs: en las webs de apoyo como takethesquare.net o tomalaplaza.net también habrá recursos.
- Noticias: Google news te puede servir para ver qué se está diciendo en la prensa, busca por 15m, 12m15m, etc.
- Feeds: he recopilado unos cuantos feeds sobre #12m15m en myfeeeds.com/15m
- Twitter: Sigue el hashtag #12M15M (la forma de etiquetar un mensaje en Twitter) o sigue otros hashtags que se estén usando en ese momento, por ejemplo #yovoy12m #volvemos12m #acampadasol y muchos más que surgirán estos días. Cambiar el hashtag permite ser más visible en Twitter.
- Remezcla, comparte, publica. Una vez que ya estamos al tanto de lo que está pasando a través de los múltiples métodos y canales arriba reseñados ¿qué podemos hacer para apoyar? La opción más sencillla es usar los métodos que Twitter, Facebook o Tumblr tienen para re-publicar el contenido tal cual.
Si tienes ganas de más puedes usar herramientas como Storify para ir recopilando las diferentes pedazos de información que vás recopilando y reorganizando para contar una historia.
También puedes grabar lo que está pasando en tu pantalla (en los diferentes video streaming abiertos) o lo que sale en las noticias de TV y publicarlo en alguan plataforma de vídeo YouTube, Vimeo, Blip.tv, Archive.org las opciones son múltiples. ¿Cómo grabas lo que pasa en tu pantalla? Camstudio.org es una opción, pero el sonido es fatal. Si conocéis otras herramientas comentad por aquí. - Escribe, contacta con los que está en la calle. Publica en la web (en tu blog, un blog, web o donde sea) lo que ves, lo que piensas, posibles acciones. A veces desde internet tienes una visión más global de lo que está pasando y puedes ayudar a los que están en la calle.
- Abre el wifi de tu casa si hay protestas cerca. Las redes 3G es probable que colapsen. #abreTuWifi es la iniciativa en Twitter.
- Continuará…
Updates for Boston area
There is a Occupy New England meeting in Wordcester, details at their Facebook page. What will the Spanish community do, this is what happened one year ago and in June 19th to show support!
La basura te lo da
Another field trip to Saugus ash Landfill
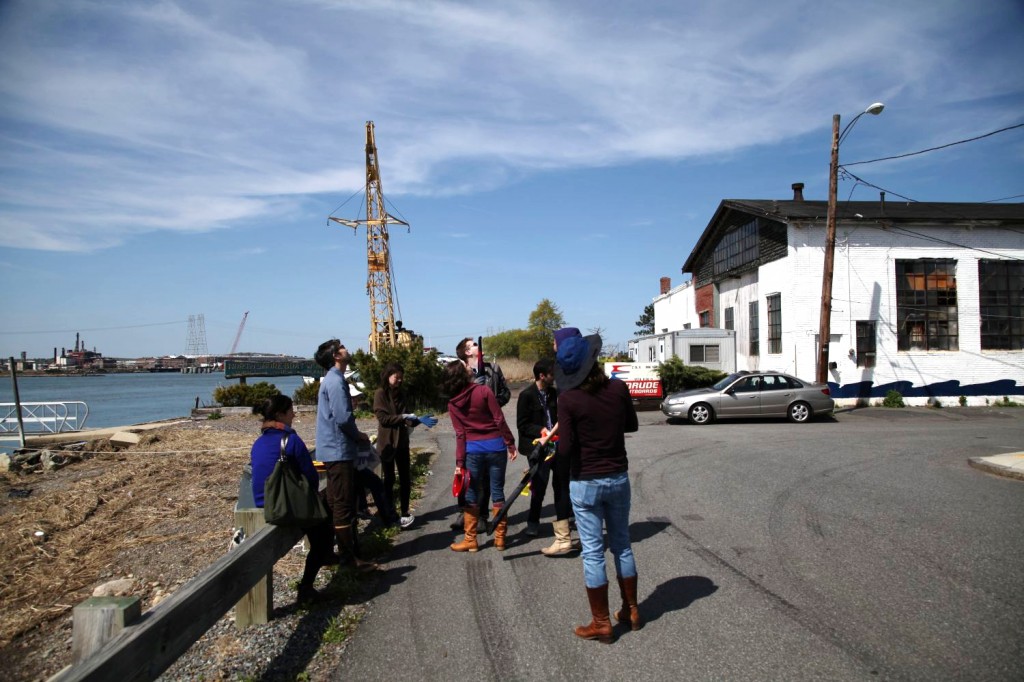
Yesterday Catherine, Jeff and people from Comparative Media Studies class repeated the visit to the Saugus Ash Landfill to make some aerial photography with balloons or kites. Wind was coming from the ‘wrong’ side and we had to move to the other side of the water to fly the kites.
Jeff has already uploaded the photos to Mapmill:
- Visible http://mapmill.org/sort/2012-
05-07-massachusetts-saugus- pier-vis (it looks like they are out of focus, which happens when the first photo is made and gets the focus to near) - Near infrared http://mapmill.org/sort/2012-
05-07-massachusetts-saugus- pier-ir
Plugmatrix at Pune
I’ve spent these past days at the Interantional Waste Picker meeting in Pune, India: tweeting, live blogging, streaming, organizing content, making photos… Find more info at globalrec.org, read the #pune2012 o lee el post sobre el evento: Derecho internacional a la basura.
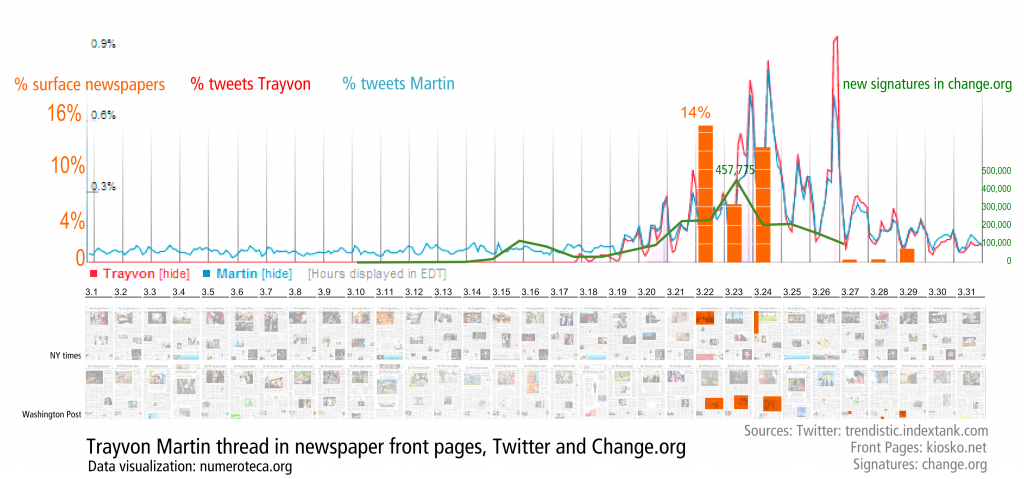
Trayvon Martin thread in paper newspapers, Twitter and signatures in Change.org
Matt Stempeck is preparing a post with all these data. Soon the link! has written a post about this: The internet didn’t make Trayvon national news but it did sustain the story.
I’ll be refining this visualization in the following days.
I saw you there
The Supermarket of the Future
It is like to drink from a fire hydrant
Vuelven las portadas #primaveravalenciana
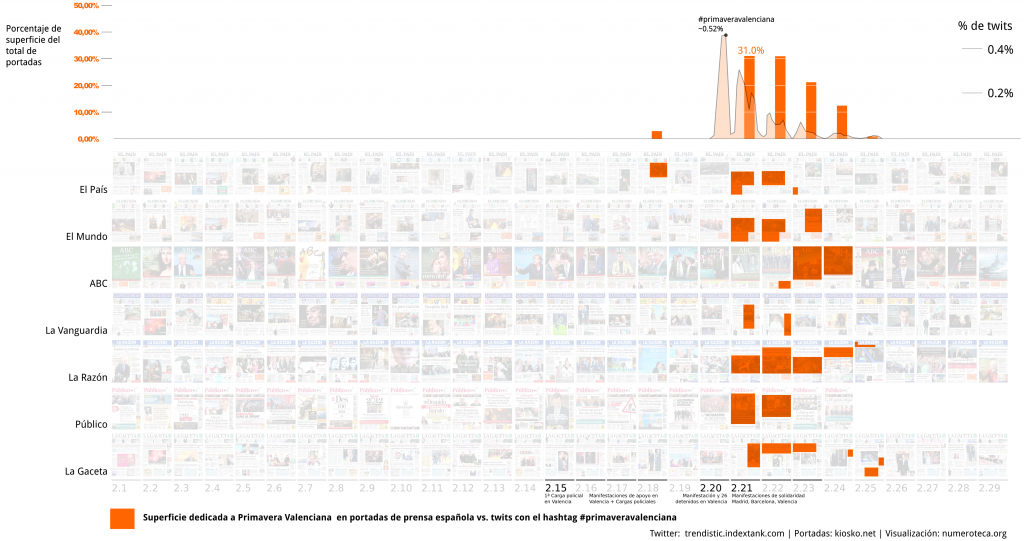
No es que se hubieran ido, pero acaso porque esté yo más sensible al tema, no paro de ver noticias que hablan de portadas y más portadas de prensa. Ese elemento que los periódicos de papel se reservan para dar su grito, y que es comentado en la radio, televisión, webs y redes sociales de internet. Parecía que Inernet iba a matar pronto a al papel, pero las portadas en papel siguen teniendo su audiencia y se resisten a ser borradas del mapa mediático. El periódico Público acaba de perder su lugar en el kiosko (25 de febrero), y el gráfico por lo menos sirve para dejar ver el hueco que deja, que acrecienta el desequilibrio entre medios de comunicación qde derecha e izquierda en España.
En el gráfico de arriba se relaciona la superficie dedicada en las portadas de prensa española a la llamada “primavera valenciana” en relación a los twits con el hashtag #primaveravalenciana. Las manifestaciones y cagas policiales comenzaron el 15 de febrero, pero hasta el día 21 no se convirtieron en primera página para la mayotía de diarios. El lunes 20 #primaveravalenciana llegaba a su pico y era trending topic, cuando se detuvieron a 26 personas tras las manifestaciones en Valencia. Un análisis posible sería ver de qué hablaban y cómo estas noticias para aportar no solo cantidad (superficie) sino un análisis cualitativo. Estamos pensando aplicar la metodología que usó Victor Sampedro Blanco en su análisis de la prensa sobre la insumisión en los años 80-90 en España y cómo se configuran las agendas políticas y mediáticas. Todo llegará.
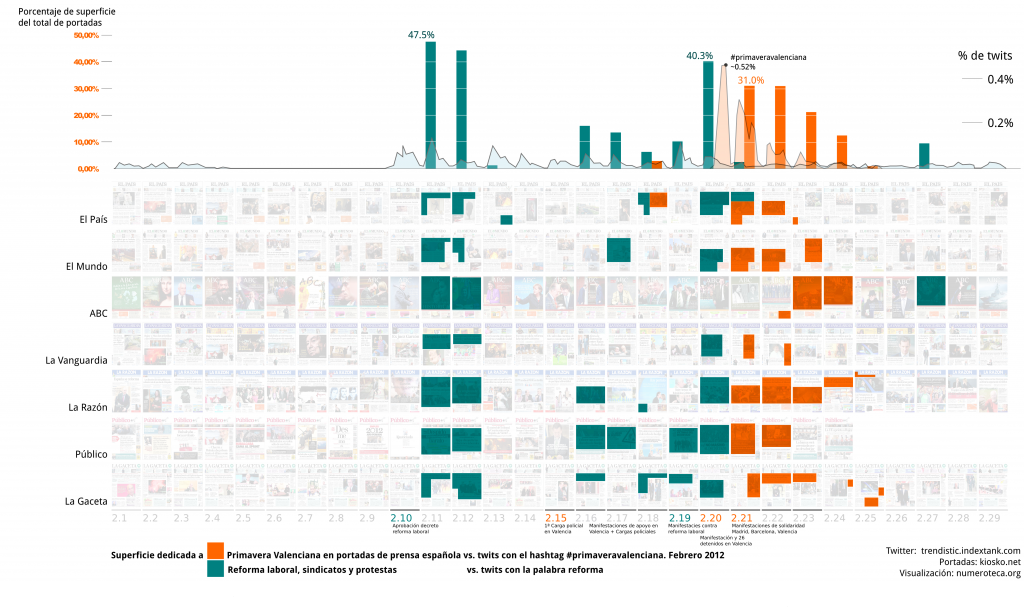
Para no deternos ahí y seguir analizando otros elementos interesantes de los movimientos sociales en febrero, hemos incluido las noticias relacionadas con la reforma laboral, los sindicatos y la manifestación del 20 de febrero. También aquí podríamos diferenciar entre los diferentes tipos de noticia. Valga por el momento esta prueba. Se incluyen los twits con la palabra “reforma”.
Con este gráfico queremos retomar el estudio de las portadas en la prensa para ver cómo configuran la agenda política y social y cómo se relacionan con los movimientos sociales. (Nota: Faltan por incluir, las portadas relacionadas con las protestas en Atenas).
Noticias y post con portadas de por medio:
- El método del incendio del Reichstag en Guerra Eterna
- Las portadas Mordaza en Guerra Eterna
- Portada de ABC sobre #primaveravalenciana “corregida”
- Sigue las #portadasABC, están marcando época
Así que parece que las portadas tienen cuerda para rato.
Downloading and erasing you google search history #unGoogle
Tomorrow March 1st all the Google services will be connected. Before erasing your search history (all the things you googled while your gmail account was opened) you can download and play with it. I’ve found a cool script by Geekland that does that for you. It converts the yunkie xml from the rss that your searches automatically create (https://www.google.com/history/lookup?q=&output=rss&num=1000&start=1) into a cvs format. You can play with the variables:
- num Number of records to output (1000 is the most you can get a time)
- start: The record number starting point (starting from 1)
Read more info RSS feed parameters
Soon: how to play with your downloaded csv.
More info about ungoogle in Spanish.
My GPS traces from last year in Cambridge
I could have also said: “All the places I went last year”, but it would not be that accurate. Instead of yuxtaposing the raw gpx tracks, I found that giving them a transparency they would tell the story better. The black spot is the consequence of not turning on the GPS in closed spaces (noise).
How to:
- Record every movement you make with a GPS.
- Download all the .gpx files from your GPS.
- Merge all your recorded tracks (.gpx files) with Merge tool (Windows).
Run the program inside the folder and it will merge all the gpx files in one. - Open the generated .gpx file into JOSM. Convert the layer to a data layer (right click button) and you’ll be able to edit the points. Save the layer as another (clean) .gpx file.
- Open Qgis and import the gpx from last step (seen in cartotalk).
- Create a new layout, insert the map and export to pdf or svg.
- Open it in inkscape (or illustrator, or freehand) and put the lines with transparency 25%.
- If your computer is ‘strong’ enough you’ll be able to export/print the resulting image (I had some problems with it).
Note: It might be a little bit to intimate to show all this traces, but it looked so nice that I had to post it. Years ago I did a similar map drawing with a pilot every movement I made on a Madrid touristic paper map. I never published it. Different tools, same story.
Frontpage analysis tool in github
I’ve just uploaded to Github (opensource repository) the tool (in Processing) to scrap, download and build the matrix of newspapers frontpages: https://github.com/numeroteca/PageOneX Update 13.11.12: Renaming https://github.com/numeroteca/pageonex-processing Feedback welcome. See examples. By the way, this is the first “aside” of this blog.
I don’t feel like it today
The way it works
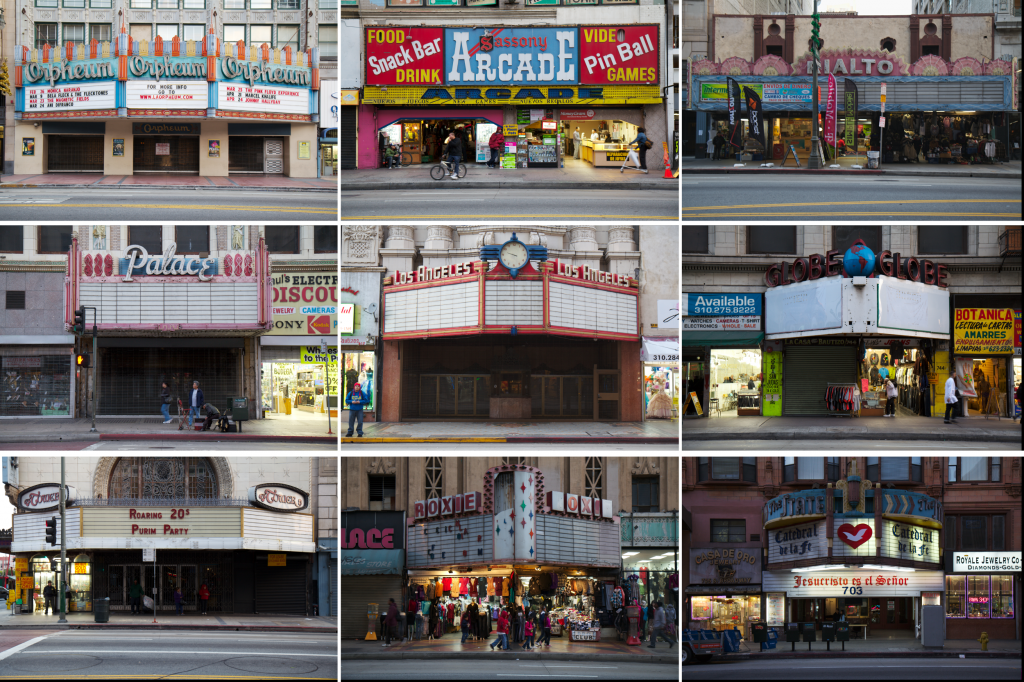
 Thanks to William J. Kelley.
Orpheum Arcade Rialto Palace Los Angeles Globe Tower Roxie The State
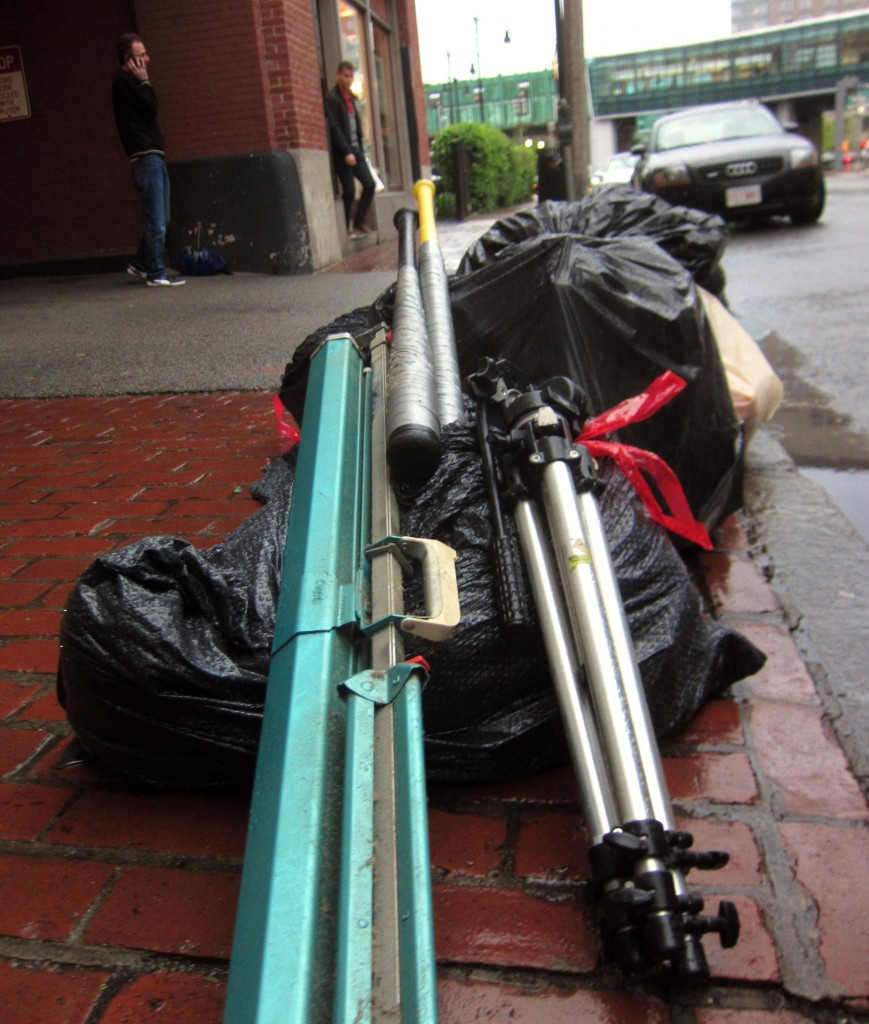
Scavenging is illegal

Found at LA Recycling Center, where a lot of waste pickers sell the cans, bottles and metals they collect.
Dark space 2
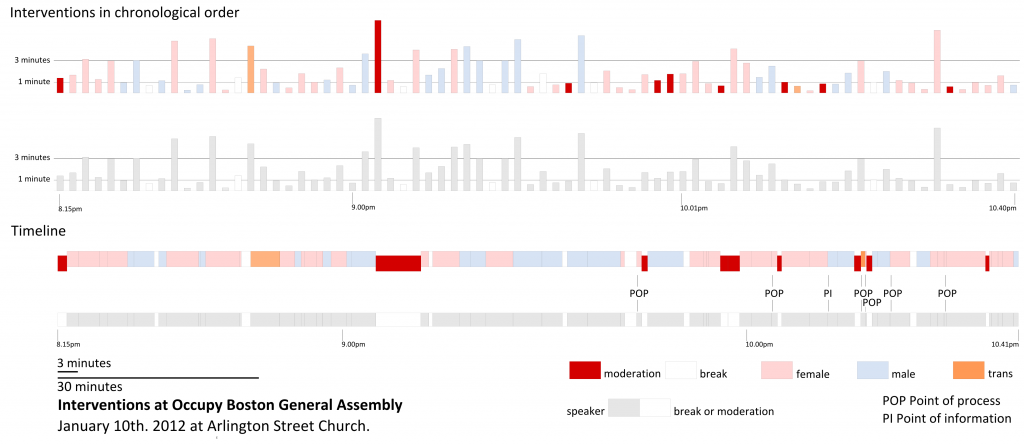
Infography: Interventions at OccupyBoston General Assembly Jan. 10th 2012
As I happened to be the time keeper for the GA, I thought it could be a good idea to make something useful with the data I had written in my notebook. The duration limit for the interventions was 3 minutes. Around 12 people, from the aprox. 39 different who spoke, exceeded the 3 minutes limit.
You can also read the transcripts of the polemic GA: http://bit.ly/OBga120110
Update: the raw data used to make the graphic http://bit.ly/OBGA2012jan10duration
Note: After some feedback: I figured out that the classification by sex would be problem. I decided to go anyway assuming that difficulty-arbitrary
dark space
Pista de hielo en el Boston Commons
OccupyBoston General Assembly December 15th 2011
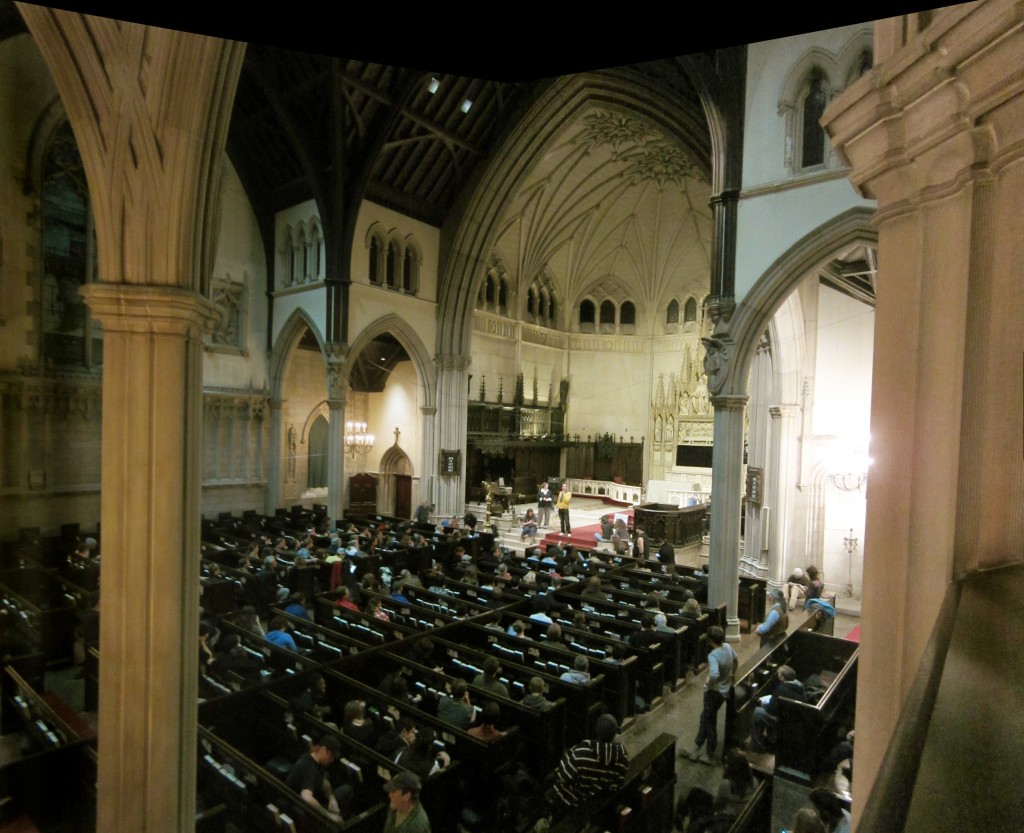
Panorama photo of Occupy Boston General Assembly (GA) in Emmanuel Churh (15 Newbury Street, Boston) on December 15th 2011.
After being evicted from Dewey Square on December 10th, Occupy Boston continues with their activities and GA i nseveral places in the city: Boston Common, St. Paul Cathedral, this emmanuel Church, and many other places. The movement keeps moving!
Surface in Newspapers front pages vs. Twitter about #ows #Occupy until December 13th
Update Dec. 18th 17.21h: added cumulutative tweets, details of # of tweets at certain moments.
Twitter data from r-shief.org in the #occupydata hackathon.
More info about the hackathon and http://bit.ly/occupyhackathon.
Comparison in US and Spanish Newspapers’ front pages about Japanese Tsunami
Here we compare how newspapers in US and in Spain cover the Japanese Tsunami (March 2011).
The aim of this comparision is to see:
- How different coverage they have towards international news.
- How long one single event (news) last in time.
- Spanish newspaper have less news per front page, they are more what are called her “dailys”: smaller in size and elongate format.
See table bellow. How that affects the use of front page space.
Table: Number of news in the front page of main Spanish and US newspapers
See full table and data.
Example:
Name: average of number of articles per front page
Spanish
El País: 7.5
El Mundo: 7.5
ABC: 4.5
La Vanguardia: 5.1
La Razón: 4.9
Público: 4.6
USA
WSJ: 34.8 (28,0 short news)
The Washington post: 13.1
The New York times: 15.5
The Boston Globe: 17.7 (9.2 short news)
USA Today: 13.0
Los Ángeles Times: 9.7
Source: data extracted from a random period of 21 days.
The chart. See the data behind in the spreadsheet:
Surface in USA Newspapers’ front pages about Japanese Tsunami and percentage
Surface in Spanish Newspapers’ front pages about Japanese Tsunami

Improved graphic from the post Analyzing Newspapers’ Front Pages.
#OccupyData Hackathon. This Friday 9th at MIT Medialab… and more locations
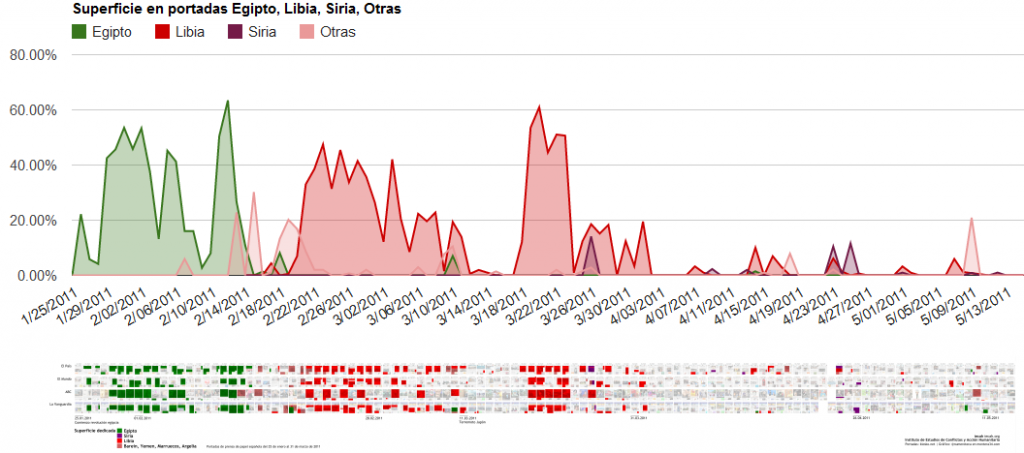
Surface coverage in Spanish newspapers’ front page about the Arab Spring
Here the interactive version of the graphic about Egypt, Lybia, Syria and other protest-revolutions.
This is a data visualization made for the Instituto de Estudios sobre Conflictos y Acción humanitaria.
–
Puedes leer el artículo de análisis de iecah.org en Estudio de la cobertura periodística sobre las revueltas árabes.
Nota: El porcentaje dedicado está calculado considerando que las portadas de los diferentes periódicos tienen el mismo tamaño, aunque en la realidad cada diario tiene diferente tamaño, y por tanto, diferente superficie total.
Fuentes: las imágenes de las portadas han sido obtenidas de kiosko.net.
Surface in Newspapers front pages vs. Twitter about #ows #Occupy Nov 30th
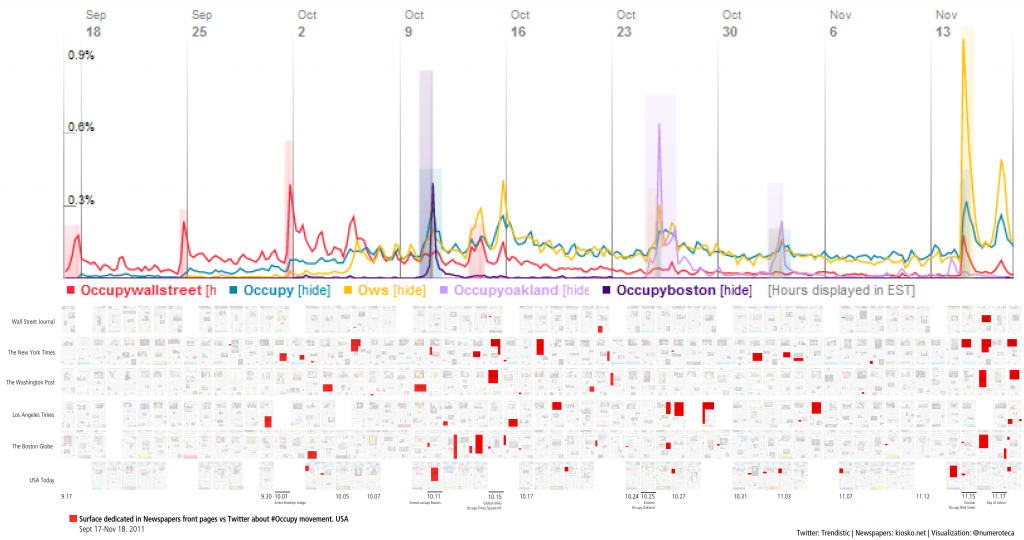
We keep making experiments with this small multiple graphic. We are now displaying the percentage of surface that #occupy is ‘using’ in the front pages of the newspapers, as making quantitative reading of surfaces is difficult for the human eye. Red bars are displaying the % of surface ‘occupied’ in the front pages.
The blue line is the number of twits with the hashtag #OWS. For the moment we only have available data from twitter from October 6th 2011. The data from Twitter are from r-shief.org who are promoting an #OccupyData Hackathon for this Friday December 9th. Find more information and join us at http://bit.ly/occupyhackathon. We will be having local sessions at the MIT Media Lab and a lecture-conference with the researchers of this investigation about Twitter and #spanishrevolution and #15M from Spain.
We are also thinking which is the best way to show simultaneously the raw data from the front pages, it’s percentage and the twits. Which vertical scales to use? number of twits by day? by the hour?
I will have more updates about this #FrontPageAnalysis project, that is still looking for a name. We have developed so far a script in Processing to generate the array of front pages.
You still can view the kind of graphic we’ve been using in the last weeks, with the twitter statistics from Trendistic.
I SINK OCCUPYBOSTON #occupythesink
A new star is born: @OccBostonSink
Boston, 1 de diciembre de 2011.Esta mañana Occupy Boston ha conseguido por vía judicial detener temporalmente las amenazas de desalojo de su campamento. En una vista los representantes de Occupy Boston han defendido el derecho de libertad de expresión frente a representantes de la ciudad, que quieren cerrar el campamento aduciendo motivos de seguridad. Esta vista ocurría justo 2 meses y un día después de que se instalara la primera tienda en Dewey Square, el trozo de parque donde se levanta el campamento.
En las últimas semanas se han sucedido desalojos, detenciones y spray de pimienta por todo Estados Unidos, quedando la “tent city” de Boston como la más veterana que no había sido todavía desalojada. Bueno, tuvo su desalojo la noche del 10 de octubre tras haberse expandido a otro parque cercano. La ciudad, entonces, no permitió esta expansión y terminó desalojando y arrestando a más de 100 personas. Desde entonces no ha habido mayores problemas con la policia hasta esta misma noche. Precisamente cuando Occupy Boston había conseguido que una juez les protegiera, al menos temporalmente hasta el 15 de diciembre, ha ocurrido uno de esos hechos que dan energía, y unas risas, al movimiento. En una de esas escenas que podrían se de Amanece que no es poco la policía ha entrado en el campamento a confiscar un fregadero (sink en inglés). A star is born #occupythesink o, como ya ocurrió en Madrid con el tacatacataca del @putohelicotero, acaban de crear la cuenta de Twitter @occBostonSink, pero ¿qué sonido hace un desagüe? ¿qué sonido hace un fregadero en un calabozo? Seguiremos informando.
Mientras, la lucha continúa a medida que nos vamos adentrando en el frío invierno de Massachusetts. Si la policía lo permite, la comisión de inviernización podrá llevar a cabo sus medidas contra el frío. Lo paradójico es que las razones que aduce la policía para realizar el desalojo son la falta de seguridad, el frío y el peligro de incendio, a la vez que no deja ni entrar material para mejorar el aislamiento de las tiendas o expandir el campamento. Con la óptica y la experiencia de lo vivido en España, lo más razonable parecería aconsejarles desmontar los campamentos, como cuando se desalojó acampadasol en una jornada festiva. Como se repitió entonces, y tanto costó consensuar en la asamblea, el objetivo no era mantener la acampada sino al movimiento en marcha, y se le dio entonces el relevo a las asambleas de los barrios. Ya se ha empezado a trabajar en esa dirección con “occupy the hood” (ocupa el barrio) aunque no es todavía lo suficientemente fuerte. Lo mismo ocurre con el resto de #occupy: tiene un apoyo amplio, repercusión en los medios, pero no parece que haya alcanzado todavía la masa crítica para hacerlo totalmente unstopable. En Boston, las manifestaciones no han superado las 5.000 personas, según mis cálculos. Por eso, la batalla por mantener el campamento de Boston abierto puede ser la forma de mantenerse despiertos y seguir organizándose y visibilizándose, pese al frío que puedan pasar. La gente está decidida a hibernar en las tiendas y florecer en primavera.
Occupy Boston puede ser un modelo para el resto de acampadas si consigue mantenerse apoyándose en la vía legal. Como comenta un periódico local, si el sistema consigue desalojarlos el movimiento Occupy habrá demostrado uno de los principales mensajes: que el sistema judicial es injusto y que protege al 1% en el poder.
http://www.youtube.com/watch?v=ExXBbal-ho0
Meme together, pepper spray + sink: https://twitter.com/#!/ddmcguire/status/142424126550839296/photo/1
Actualización: publicado en madrilonia
Modos de archivar
Esto es lo malo de no hacer imprimir las obras: que se va la vida en rehacerlas.
Cuestiones gongorinas, Alfonso Reyes
Desde hace ya unos meses ya se puede visitar la nueva web de Basurama que tanto nos costó sacar a la luz. Es el nuevo archivo de proyectos, aunque aún no hayamos terminado de mudar todo el contenido de la antigua web. Hemos dividido el contenido en proyectos y noticias. Los primeros recopilan la información de todo lo producido en relación a un proyecto y las segundas hablan del día a día de los proyectos, convocatorias, anuncios… El área de noticias es también el lugar para hacer referencia a las otras webs y post que se publican en la red de Basurama: 6000km.org, obsoletos.org o el blog. De hecho, estoy pensando si debería integrarse más todo ese anillo de webs: un header como el de weblogsSL o directamente incluir los feeds. Añadiría algo de “ruido” a la portada, aunque no tendría por qué ir el contenido allí.
Pero de lo que quería escribir es sobre el interesante debate sobre cuándo publicar un proyecto, cuándo un proyecto pasa a formar parte del archivo.
Para Manu el archivo de proyectos de Basurama debe tener sólo la información limpia, ordenada y estructurada acordada por todos. De este modo, los proyectos publicados solo formarán parte del archivo una vez estén acabados y con toda la información lista: mejor proyectos bien publicados, que más proyectos, pero con escasa, inexacta o excesiva información (producto de un texto que se ha escrito mientras el proeycto evolucionaba). Un proyecto en marcha irá generando información en forma de post en el blog o “noticias”, pero no estará en el archivo.
Desde mi punto de vista pienso que la web y el archivo son la puerta para recopilar toda la información que generamos en Basurama. El relato de un proyecto es la suma de los post que se escribieron, las noticias, el resumen que se hizo después y mucho más. De este modo un proyecto pasaría a formar parte del archivo desde el mismo momento en que se va a realizar: un texto resumen, unas fechas (puede que al principio orientativa). En Basurama, y en cualquier otro sitio, nunca hay tiempo para recopilar la información, siempre estamos con el siguiente proyecto en mente y con el próximo en las manos. La información que producimos en un instante durante un proyecto, puede no ser el mejor resumen, pero sí aporta visiones y experiencias que no deberían perderse. Recuerdo que una vez, en la antigua web en html, incluimos todos los post sobre el proyecto de RUS México (ver abajo) en la propia página: contenido generado en diferentes plataformas unido con agregadores. Ahora, como usamos wordpress, sería mucho más sencillo contextualizar los post relacionados en la web de un proyecto. Así, un proyecto que tenga poco contenido incialmente se alimentará de lo que se publique en el blog, de las noticias, si están etiquetadas convenientemente (o de los tweets conun determindao hashtag). Esto que propongo no es otra cosa que adoptar el modelo de las wikis para ir editando el contenido, porque nunca acaba de editar un texto. Siempre hay aspectos editables, actualizaciones, nuevas y mejores fotos. Además, me parece importante que cada proyecto tenga asociada una URL fija, a la que poder referir a los interesados desde el inicio.
Vivimos produciendo información continuamente ¿no sería bueno poder controlar esos flujos y canalizarlos convenientemente? La recopilación de esta información en buto, sin embargo, no debería estar reñida con el contenido bien clasificado y ordenado. ¿Cómo entendéis el archivo?
Superficie dedicada al terremoto de Haití en las portadas de prensa española

Más información: http://www.iecah.org/web/visual/haiti.htm
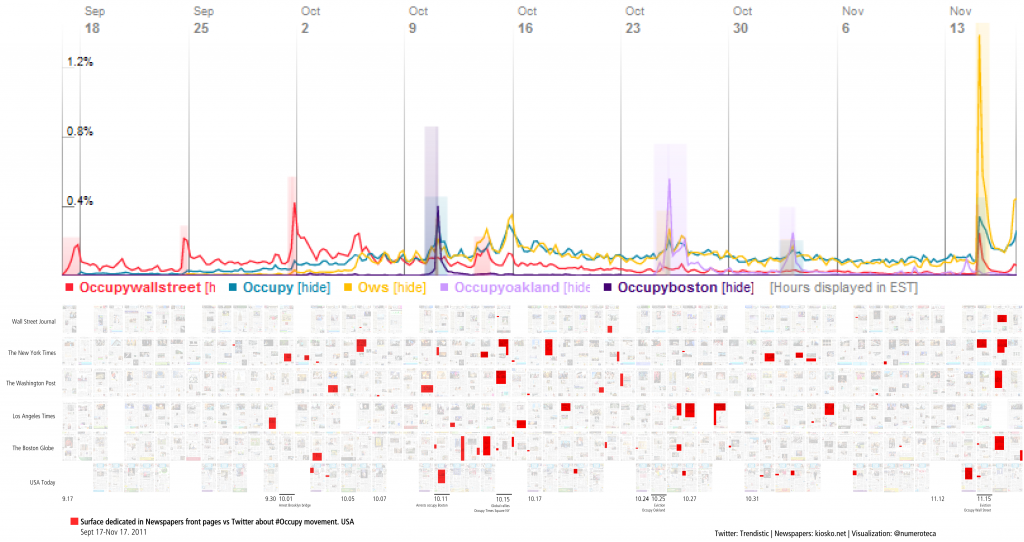
Surface dedicated in Newspapers front pages vs. Twitter about #ows #Occupy #occupywallstreet Nov 17th
March at #occupyboston Day of Action Nov 17th
Surface dedicated in Newspapers front pages vs. Twitter about #ows #Occupy #occupywallstreet Nov 17th
Metasetas

Mi participación en el concurso de fotos de la Sociedad Micológica de Madrid.
Según mi experto, puede que se trate de una Stereum hirsutum.
[Actualización: no he ganado, pero qué bueno es participar].
MIThenge
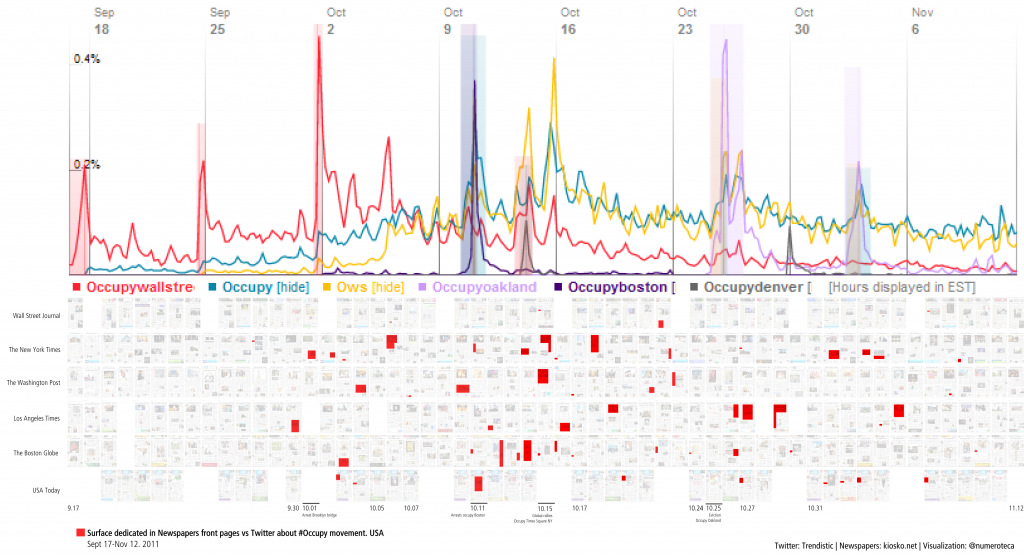
Surface dedicated in Newspapers front pages vs. Twitter about #ows #Occupy #occupywallstreet Nov 12th
A night occupying Harvard: videos and photos
Videos:
- March going out of Harvard Yard #occupyharvard Nov 9 2011 7.33pm http://www.youtube.com/watch?v=NO3FZoBtWns
Wellcoming and explaining how the asembly is going to work. - March before Harvard Yard occupation 7.37pm #occupyharvard Nov 9 2011 http://youtu.be/0AWMFJf45X0
People marching from Harvard Yard, where only people with Harvard ID could get inside. Heading north to the Law School yard where the general asembly took place. - First intervention at first #occupyharvard General Assembly (watch streaming) Nov 9 2011 http://youtu.be/T_XB1NCJkRg
- Professor Timothy P. McCarthy at the first General Asembly of #OccupyHarvard Nov 9 2011 8.03pm 1/2 http://youtu.be/g5mzbPAX4j8
- Professor Timothy P. McCarthy at the first General Asembly of #OccupyHarvard Nov 9 2011 8.04pm 2/2 http://youtu.be/KI2dmvduktI
Professor Timothy P. McCarthy (Adjunct Lecturer on Public Policy at Harvard Kennedy School of Government) talks in the first general asembly:“…where we can be heard, where we can be seen, and where we can occupy. Harvard as I said, has been occupied before, (…), we occupied where Harvard has been complicit in Apertheid in South Africa (…) living wage. (…) We must occupy again, because Harvard employs the very people who were responsible of the global economic metdown and the political institutions that facilitate it, that have created the suffering that engulfs not only this nation but the globe a a whole. Harvard is complicit (…) Harvard has economists that teach us that profits are more important that people. And we are here tonight to say that this is more important than war, to say that people are more imporant than profits, and to say that the majority is right and the minority at this hour in history. The 1% is scared because the 99% is globalized. We are 99% percent, and it is time to take back this world. Peace”.
- March going to Harvard Yard occupation 9.00pm #occupyharvard Nov 9 2011 http://youtu.be/cNdRquoakE0
After passing the proposition in the GA the march goes to occupy Harvard Yard. - Closing north gates at Harvard Yard. 9.07pm Nov 9. #occupyharvard http://youtu.be/cdN5l_397dY
Photos:
#occupyharvard General Assembly at Harvard Yard north gate Nov 9 2011 9.16pm
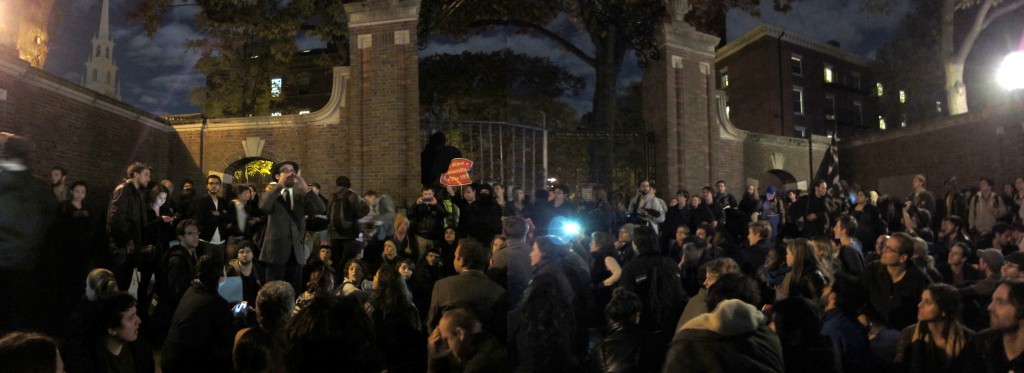
(panorama photo)
General Assembly at Harvard Yard north gate after closing the gates when the march was entering (video).


