This page is a summary of all the extra content of the dissertation: Color of corruption. Visual evidence of agenda-setting in a complex mass media ecosystem submitted on December 2022 by Pablo Rey-Mazón. Information and Knowledge Society Doctoral Programme. Universitat Oberta de Catalunya (UOC).
The full text of the dissertation can be found at UOC repository.
The page is a work in progress website that currently serves as support material for readers of the dissertation. Once presented, on May 8th, 2023, it will contain more material.
Puedes leer en castellano un resumen sobre la evolución del proyecto.
Chapters
Every week I’ll be publishing new chapters. Stay tuned!
- Abstract
- Prologue
- Part I. Theoretical framework
- Part II. Research design and Methodology
- 5. Objectives, hypotheses, and questions
- 6. Indirect measures of corruption in Spain
- 7. Research design: tools / instruments
- Part III. Fieldwork, analysis and results
- 8. Longitudinal study 1. Front page newspaper analysis: 2001-2011
- 9. Longitudinal study 2. Front page newspaper analysis on Corruption: 2009-2019
- 9.1 A graphical approach
- 9.2 Fragmentation of the corruption agenda
- 9.3 Co-occurrence in the agenda
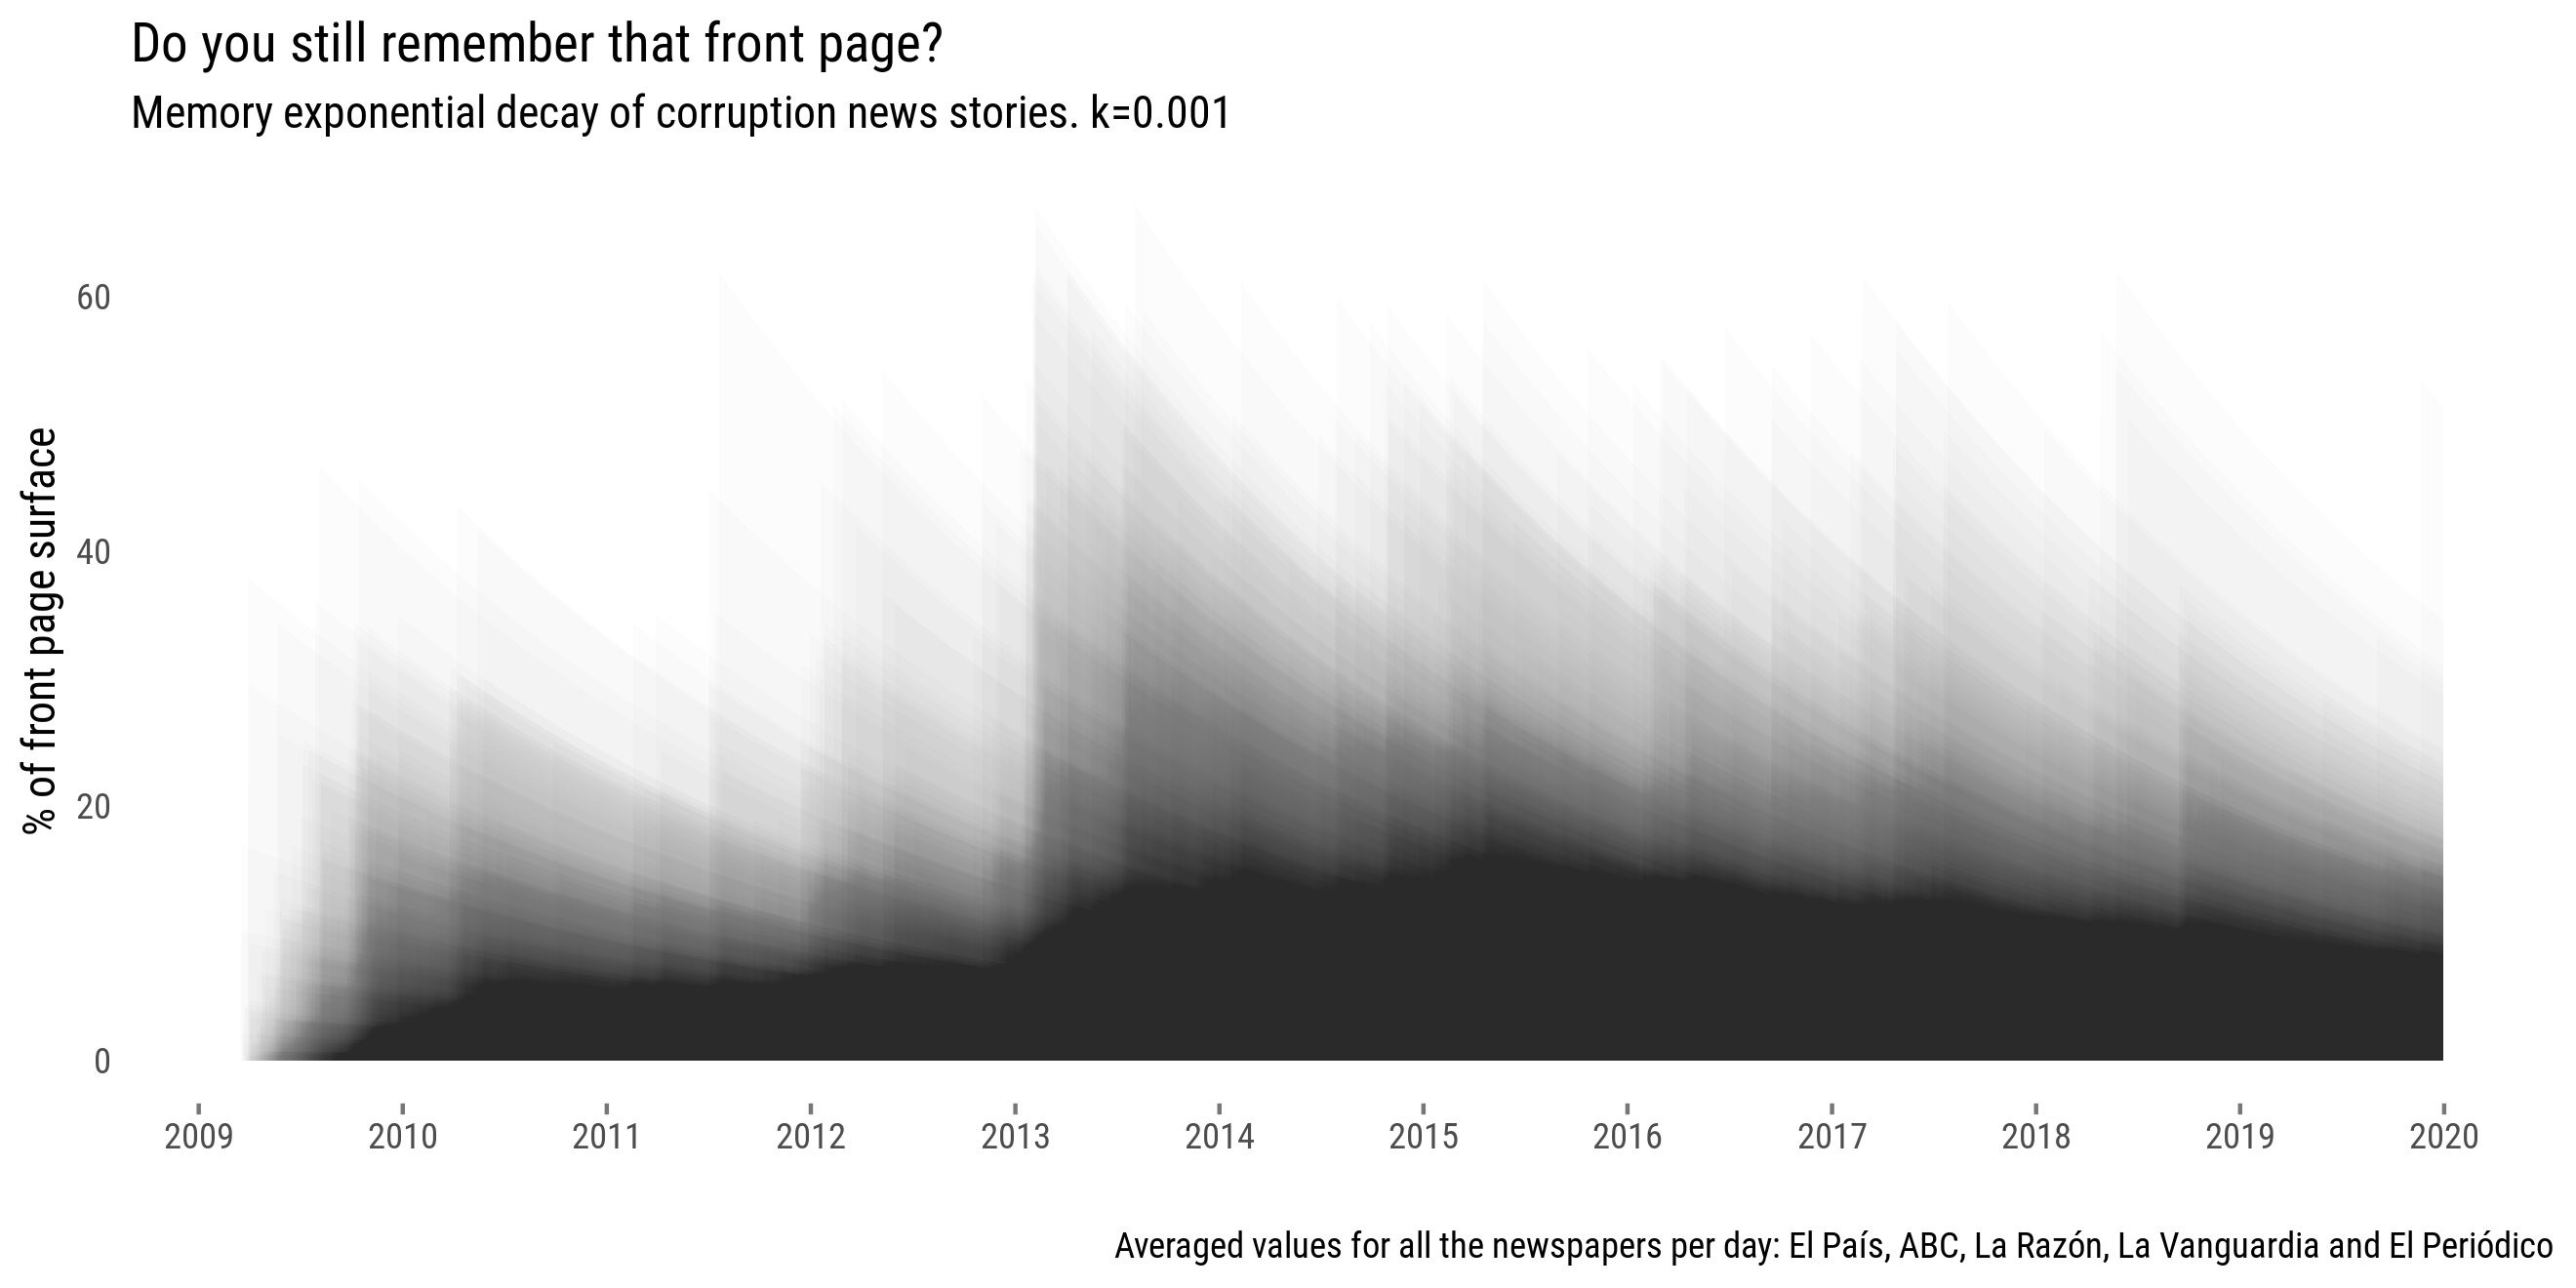
- 9.4 Memory decay model
- 9.5 Google Search
- 9.6 Color of corruption: coverage by newspaper and institution
- 9.7 Review of findings
- 10. In-depth case study: the Cifuentes’ Master scandal
- 11. Discussion
- Part IV. Conclusions
- 12. Conclusions, limitations, and future work
- 13. Bibliography
- Annex
- 14. Open code and data
- 15. Extra data visualizations
License
This work is licensed under a Creative Commons Attribution-Share Alike 4.0
International License.
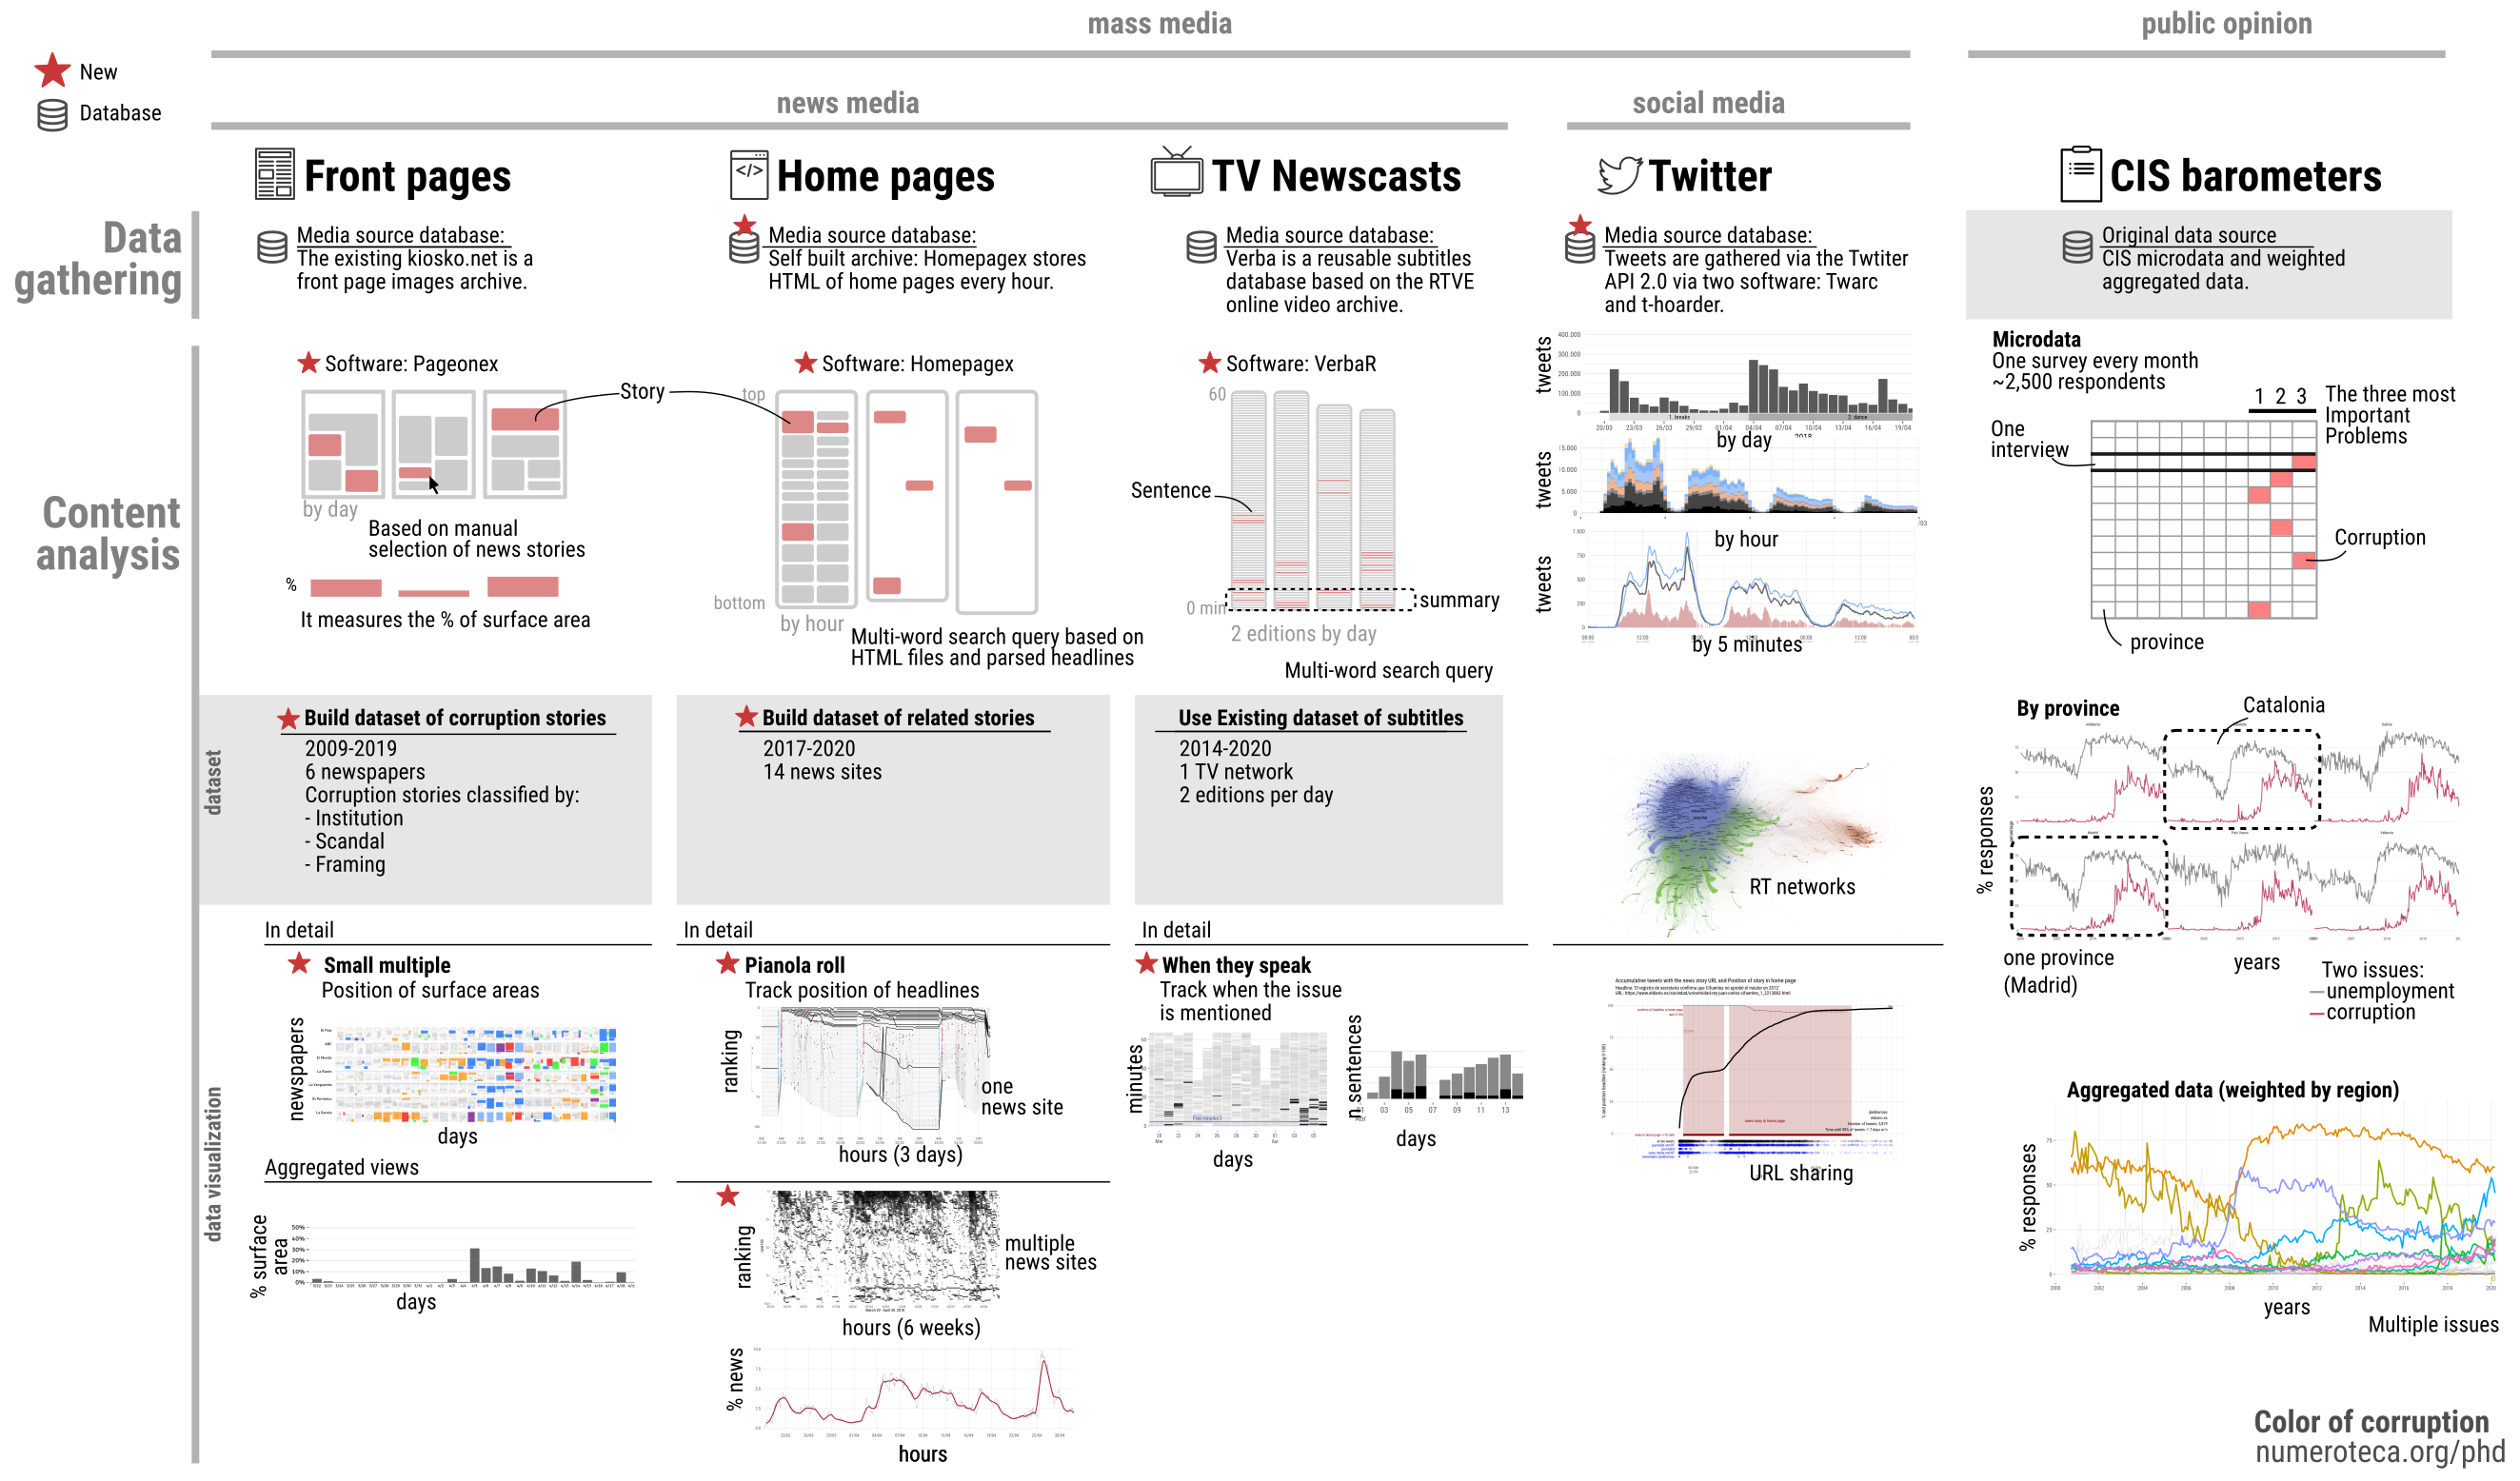
Content analysis tools
- Front page analysis. Pageonex http://pageonex.com/
- Home page analysis. Homepagex. https://code.montera34.com/numeroteca/homepagex
- TV newscasts analysis. VerbaR https://r.montera34.com/users/numeroteca/verbar/app/
Databases and data visualizations
A backup of the data sets can be found at OSF project page: https://osf.io/gpm8x/
Color Corrupción (2009-2019)
Space dedicated to corruption in El País, El Mundo, ABC, La Razón, La Vanguardia and El Periódico front pages of newspapers from March 2009 to December 2019 by institution involved, scandal and attack/defense framing develope with Pageonex software.
Data visualizations:
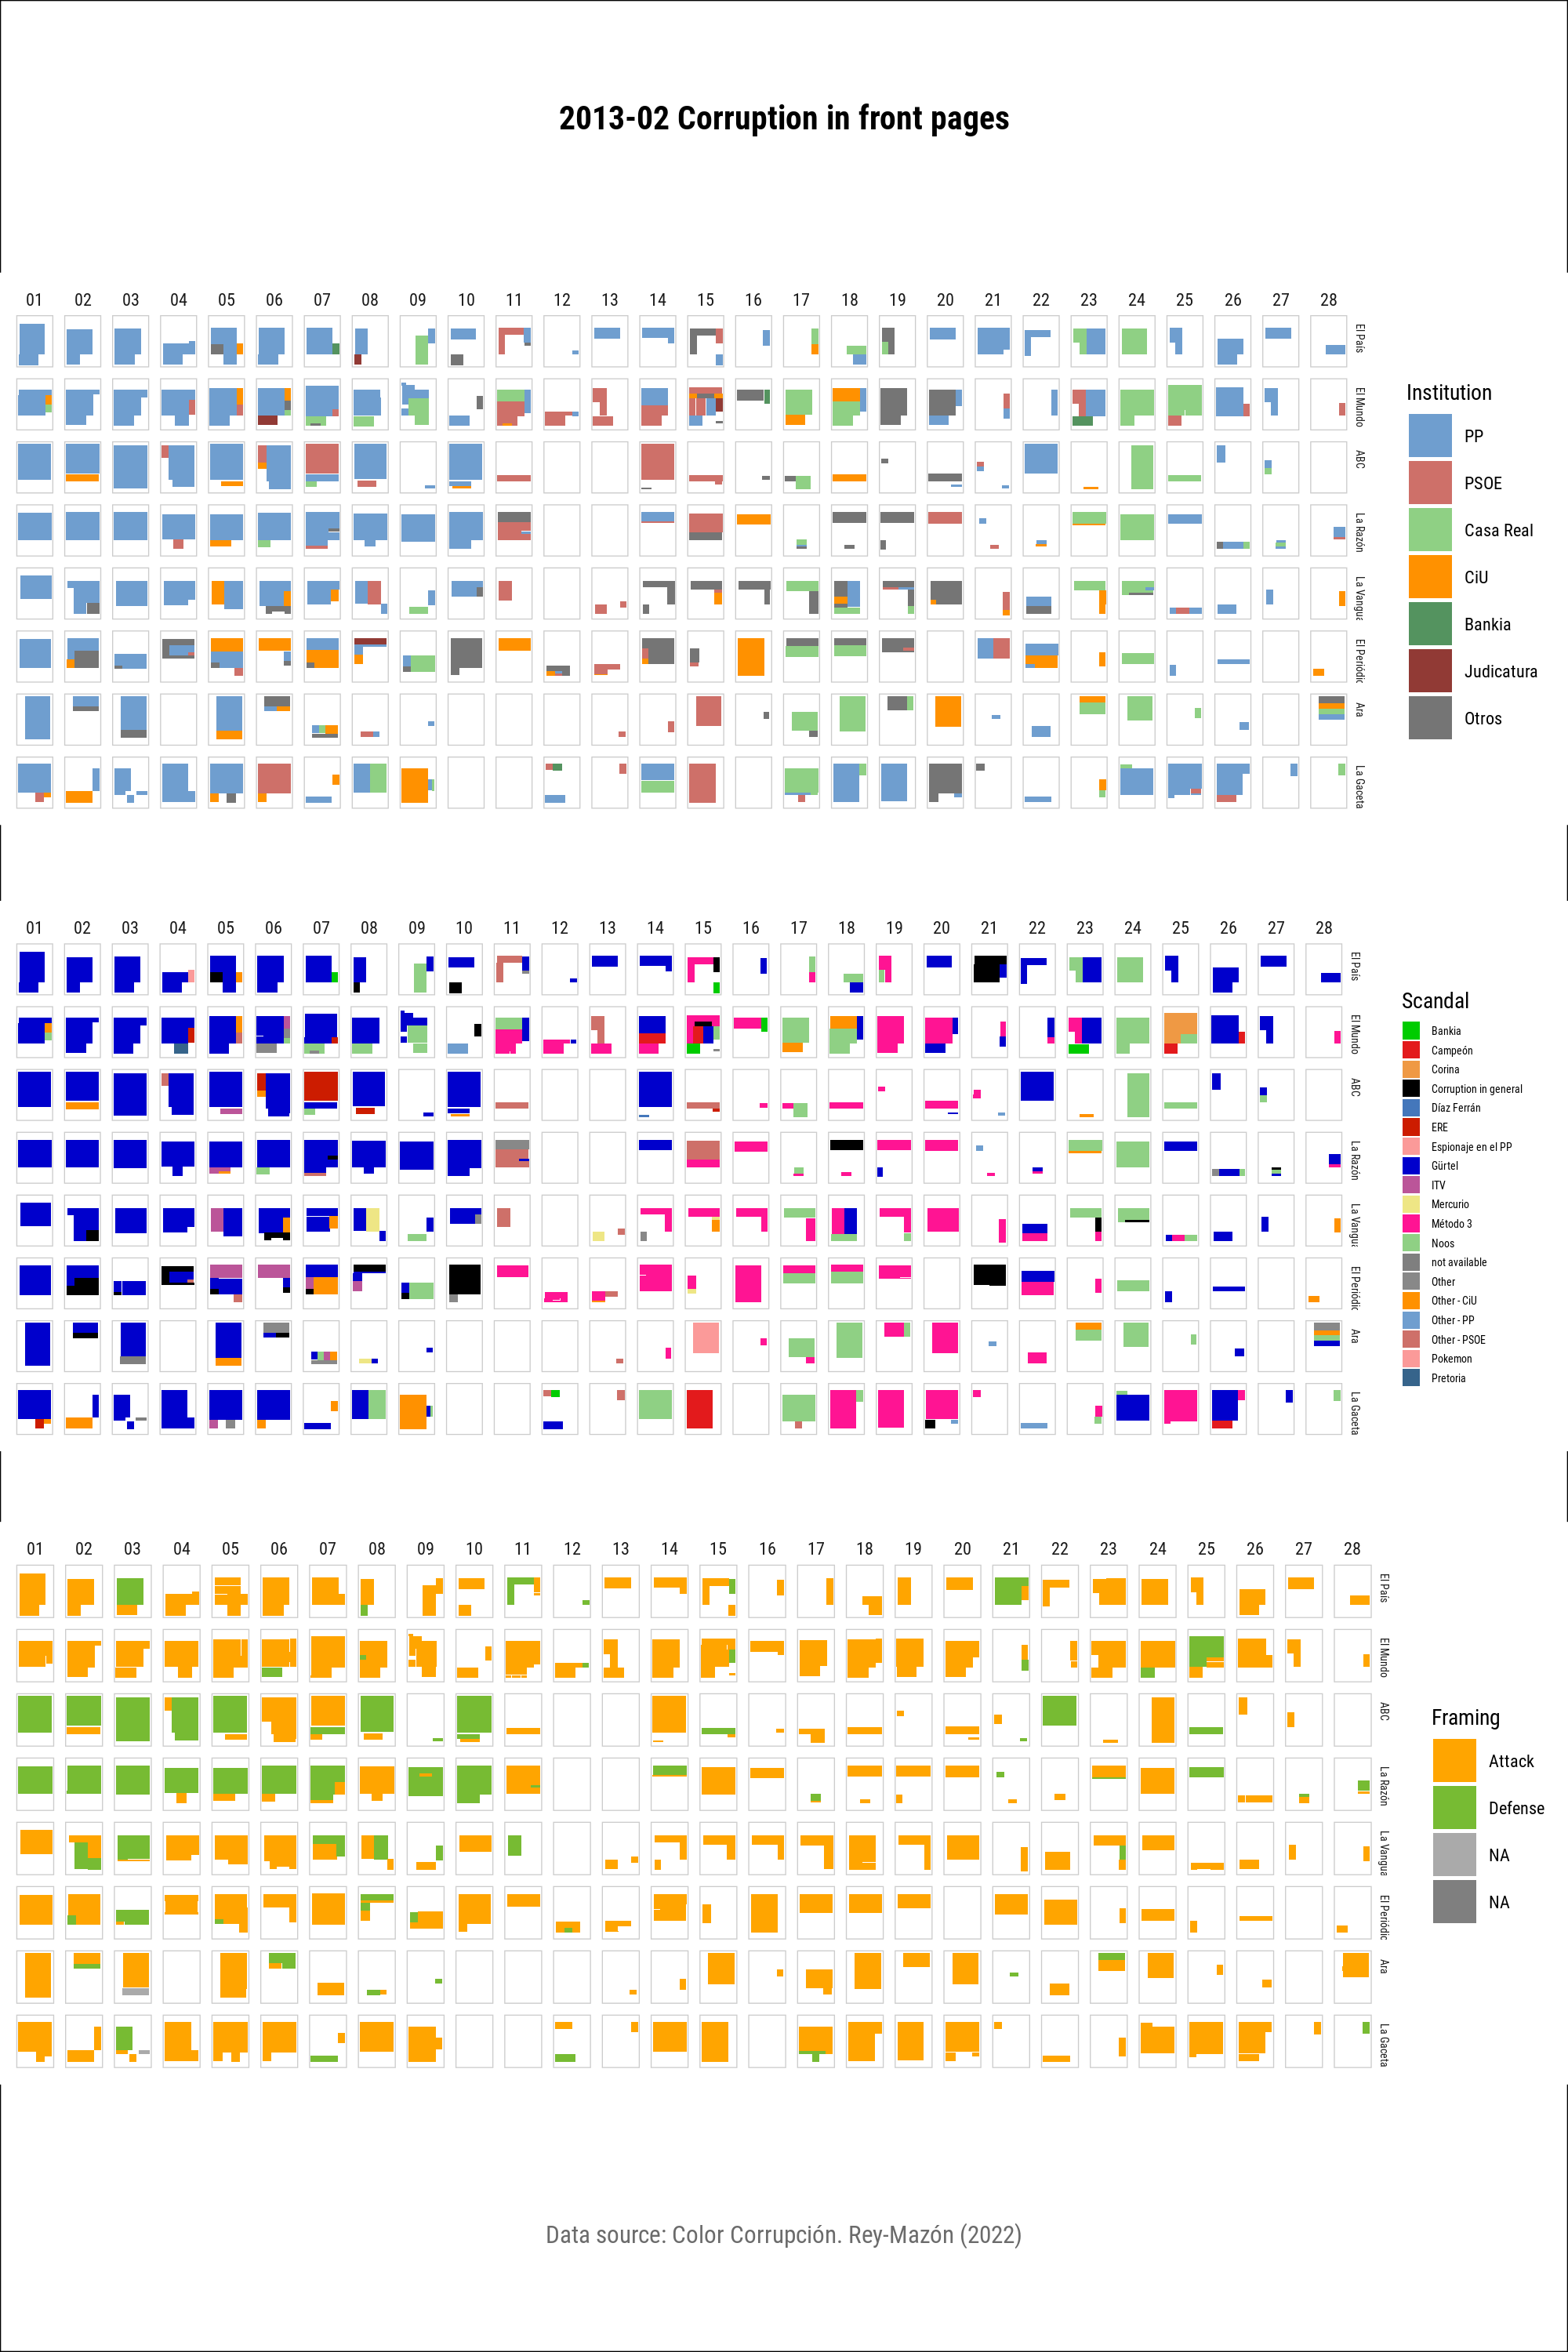
- Front pages by month. Small multiples.
- Timelines. Heatmaps, line and area charts.
- Intercoder Reliability. Small multiples.
Cifuentes’ Master Scandal (March-April 2018)
Analysis of the first 6 weeks of the scandal. From 2018-03-21 to 2018-04-30.
- Twitter:
- Twitter and home pages: Interactive: Home page headlines position and tweets that link to them.
- News sites Home pages:
- Interactive data visualization with the 0-100 position: https://p.numeroteca.org/tesis/interact/master-cifuentes2018-headlines-ranking_01.html
- Interactive data visualization with the position among the scandal related stories https://p.numeroteca.org/tesis/interact/master-cifuentes-headlines_0.html
Code and data repositories
This is the list of code repositories that host all the scripts used to develop the data gathering, data analysis and data visualizations for the current research.
Newspaper Front pages
PageOneX: a software to help analyze newspaper front pages and measure the surface area dedicated to pre-selected topics.
- Code: https://github.com/montera34/pageonex/
- Online instance: http://pageonex.com
- Color Corrupción: how to download the monthly threads (2009-2019) that measure corruption coverage about corruption in Spanish newspapers. Code: https://github.com/numeroteca/colorcorrupcion
- R scripts to analyze Pageonex. Code: https://code.montera34.com/numeroteca/pageonexR
- Agenda y voto (CIS) analysis: R scripts to read data from existing study and calculate percentage of coverage by party, year and frame https://code.montera34.com/numeroteca/agendavotocis
Home pages
Homepagex: analyzing home pages with R and downloading home pages with python https://code.montera34.com/numeroteca/homepagex
Public opinion
Analyzing Barometro CIS, and comparing it to news coverage (SPA and POX databases) with R: https://code.montera34.com/numeroteca/barometro_cis
Analysing tweets with R: https://code.montera34.com/numeroteca/tuits-analysis
TV newscasts
- Analyze TV news with Verba data: https://code.montera34.com/numeroteca/verbar
- Online version “When they speak about you in the Telediario” https://r.montera34.com/users/numeroteca/verbar/app
Multiple channels
- Compare media channels https://code.montera34.com/numeroteca/ekosystemedia