This doctoral research analyzes empirically how mass media contribute to shaping public opinion in the digital era, at a time when social networking platforms are a structural component of the media ecosystem. Corruption perception and corruption scandal stories in Spain are used to measure how news and social media influence the public agenda and how long it takes for them to have their maximum effect. During this period, corruption has climbed to one of the first positions on the public agenda, becoming one of the country’s most important problems. Other public agenda issues are also examined to compare variances in agenda-setting effects for different issues.
This dissertation is grounded in the field of media and communication studies, with strong ties to other disciplines such as political communication, corruption and journalism studies. It employs agenda-setting theory as its main theoretical framework and uses other related theories where needed. On the analytical level, a robust data visualization background permeates the whole dissertation. Visual evidence is used to explore and enrich the analysis of news and public opinion. Different statistical analysis are employed to support the evidence obtained through data visualization. Sometimes, certain data visualization techniques are explained, while others are left implicit for brevity. Often, statistical analysis come to support what data visualizations produces.
This research is based on a empirical and multidisciplinary visual analysis. Its main contributions to Social Science are related to the development of innovative methodologies regarding data gathering and visual analysis of news and social media channels on the empirical and instrumental level.
1.2 Dissertation themes and context #
Agenda-setting in the social media era
Mainstream media determine what is important and what is not by selecting and framing stories. Thus, mass media play a key role in shaping public opinion, called “agenda-setting” in communication theory. Research has shown that news media have been successful in telling people what to think about and maybe not that successful in telling audiences what to think (Cohen, 1963). Until recently, mainstream media meant books, newspapers, magazines, radio, and television, with all except books grouped under the term “news media”. Included under the definition of ‘mass media’ is the dissemination of this media via broadcasting (Luhmann, 2000).

Since The agenda-setting function of mass media (M. E. McCombs & Shaw, 1972) was published in 1972, the agenda-setting theory has expanded and explored multiple fields (M. E. McCombs, 2004). It has analyzed not only news agendas, just a subtopic of the broader agenda-setting research, but also, among other issues, the transference of salience from the news agenda to the public agenda. The theory now attempts to explain second and third level agenda-setting1, from attribute salience to networked agenda-setting, and has evolved to consider other related questions like intermedia agenda-setting, framing, agenda-cutting, or agenda-melding.
The emergence of new communication channels thanks to the expansion of broadband Internet use and the widespread use of mobile devices and smartphones has had two significant effects: first, it has enabled the general public new ways to participate more directly in the public sphere; second, and as a consequence of this, it has modified the mass media ecosystem, which was until now only accessible to the elites mainly through the news media, who were the traditional gatekeepers of the public agenda. Especially during the last two decades, society has witnessed the growth of social media influence, first with the blogosphere and later with social network sites and apps, that apparently challenged the dominant way news with which media built the public agenda2. Mass communication has moved partly from the large-scale distribution of identical messages to a personalized flow of messages through channels like Facebook, Youtube, or Twitter on a massive scale (M. E. McCombs & Valenzuela, 2021), where users can publish and re-share/re-mix messages. Scandals like the Facebook-Cambridge Analytica during the United States primary elections and presidential campaign in 2016, where information of 50 million Facebook users was used, showed the power and dangers of targeted and personalized political advertising (Kaiser, 2019).
News media remain critical players in the mass media ecosystem, but they are no longer alone in shaping the political reality. The introduction of the term “media ecology” in the 1960s by theorists including McLuhan and Postman made communication scholars understand and study media as interconnected to each other and society (Strate, 2004).
An event or scandal related to a public issue can raise the position of an issue on the public agenda within days or weeks. The amount of news coverage before an opinion survey can explain the shifts in public opinion in the short term (McCombs & Shaw, 1972). Different time-lag studies have found various periods in which news coverage substantially affects public opinion, ranging from weeks to months. Literature shows that this depends on the type of issue (obtrusive-unobtrusive), previous coverage, novelty, and receivers’ attitude (need for orientation). The principal/most used hypothesis (to the extent that is not made explicit in most agenda-setting literature) employed is that there exists a linear correlation between news coverage and its effect on what people think about in the short and long term. To explain long-term trends and non-linear relationships, Watt et al. (1993) introduced the model of “accumulated declining coverage effects,” where they applied several general cognitive processes, such as memory. They used exponential memory decay to calculate a more accurate measure of how news coverage impacts the public agenda, where news closer in time had more weight than older ones with little or no effect. In other words, they considered how humans forget stories and issues.
The current media ecosystem: news and social media
In media studies, researchers address the complexity of multiple information channels to understand how the news and social media depict reality and how multiple variables modify the impact of communication. They use multiple data sources to build a more detailed and comprehensive panorama of the media ecosystem and its interactions with the real world. Using multiple data series of news and social media metrics, together with Google searches, change.org signatures, or bit.ly clicks, has enabled them to describe with more accuracy the current mass media communication flows (Graeff et al., 2014; Lotan et al., 2011; Matsa et al., 2017; Nahon et al., 2013).
News media
Under agenda-setting theory, scholars have analyzed the mass media ecosystem using multiple channels, including television, newspapers, news websites, magazines, radio, and social media. The amount of coverage for single issues, or the ranked list of issues, of the media agenda is compared with the public agenda to look for similarities and correspondence to measure possible agenda-setting effects.
Content analysis can be performed through manual, semi-automated, or even automated processes. For example, communication scholars have long analyzed newspaper front pages as a proxy of the entire media ecosystem, using the number of stories or column inches as an indicator of mass media attention (Herman & Chomsky, 1988). As early as 1928, Gladstone H. Yeuell used column inches as a measure to analyze the coverage of news (Yeuell, 1928). Various studies have found that newspapers set the agenda for other mainstream media, such as television networks and radio broadcasts (Boyle, 2001; M. McCombs et al., 2000), called intermedia agenda-setting.
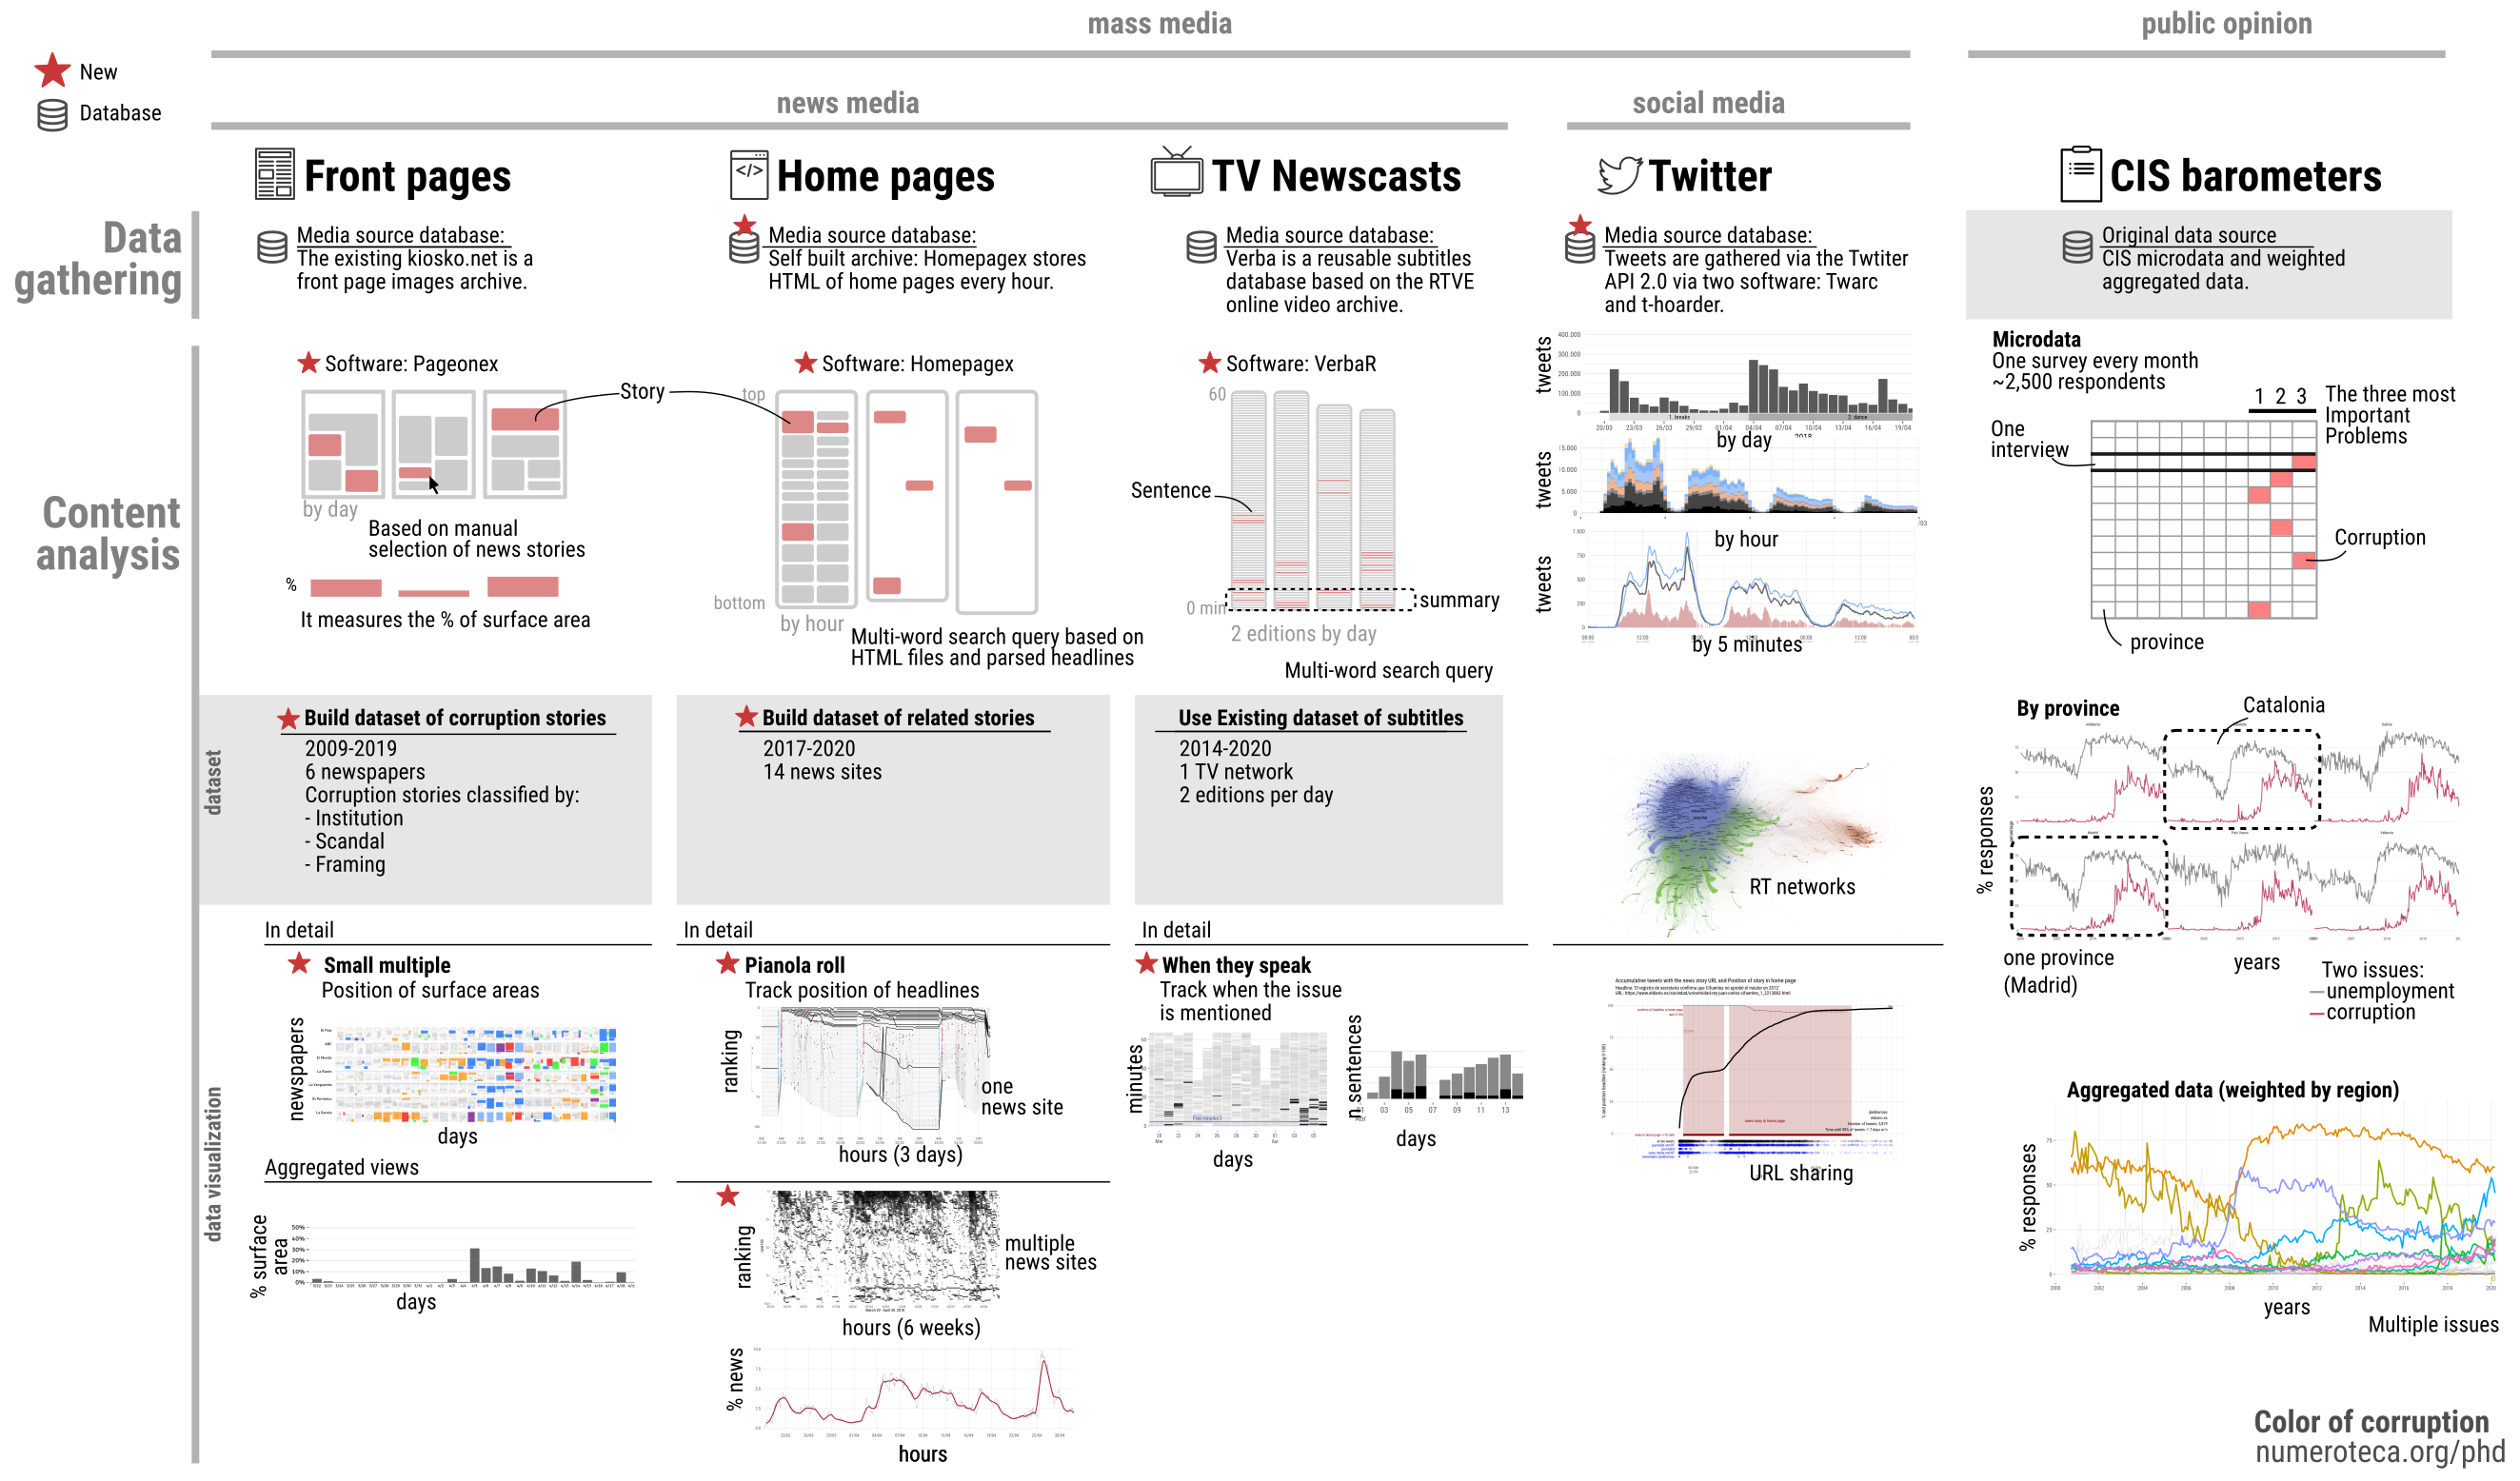
Although front page analysis is not new, I present in this dissertation new methods, like Pageonex (see Fig. 2) and Homepagex (Fig. 11) software/tools, developed to produce graphics and more accurate metrics of front pages of printed newspapers and home pages of news websites. In addition to the size and position of the analyzed stories for daily paper newspapers, I measure and track the hour to hour evolution, ranking position, and relative number of news stories in online news sites, to provide more nuanced metrics of the news media agenda than the mere counting of articles. To produce these analyses, I had first to build a database of homepages of the leading Spanish news sites. For television news, I use a recently published dataset of television newscasts of the public-service broadcast television network in Spain (RTVE) called Verba (Fundación Ciudadana Civio, 2022). The news story’s appearance, repetition and position in time in the newscast are used as a measure of salience. Like before, these nuanced metrics try to account for the prominence provided to the news stories by newsrooms (Watt et al., 1993) and enrich more simplistic approaches that only use the number of news stories.
Through the combined analysis of all these news media channels and Twitter, it is possible to understand how the coverage of the different parts/pieces of the media ecosystem interact and influence each other. Additionally, Google Search metrics are used as a proxy for people’s direct and immediate reaction to mass media coverage.
Social media
Social media channels are also studied in this research, in addition to mainstream news media, to draw a more accurate picture of the media ecosystem. As it happened with the emergence of alternative media, like the surge of blogs in the early 2000s (Kelly, 2008), social networking platforms like Facebook and Twitter, to cite two of the most important examples, have become relevant tools that drive a significant amount of the Internet traffic and people’s attention.
Social media have become a common way among scholars to measure how different actors –political parties, social movements, news media, and society in general– frame and deliver their messages in the new media ecosystem, or “networked public sphere” (using Yochai Benkler’s phrase) (Benkler, 2008). In this research, Twitter messages are analyzed as a proxy for the social media ecosystem, even if existing literature shows they are not representative of society (Bruns & Stieglitz, 2014). The percentage of people in Spain that had an account on this microblogging platform was 16.2% in 2019 (CIS Barometer, December 2019), compared to 47% for Facebook and 25.4% for Instagram3.
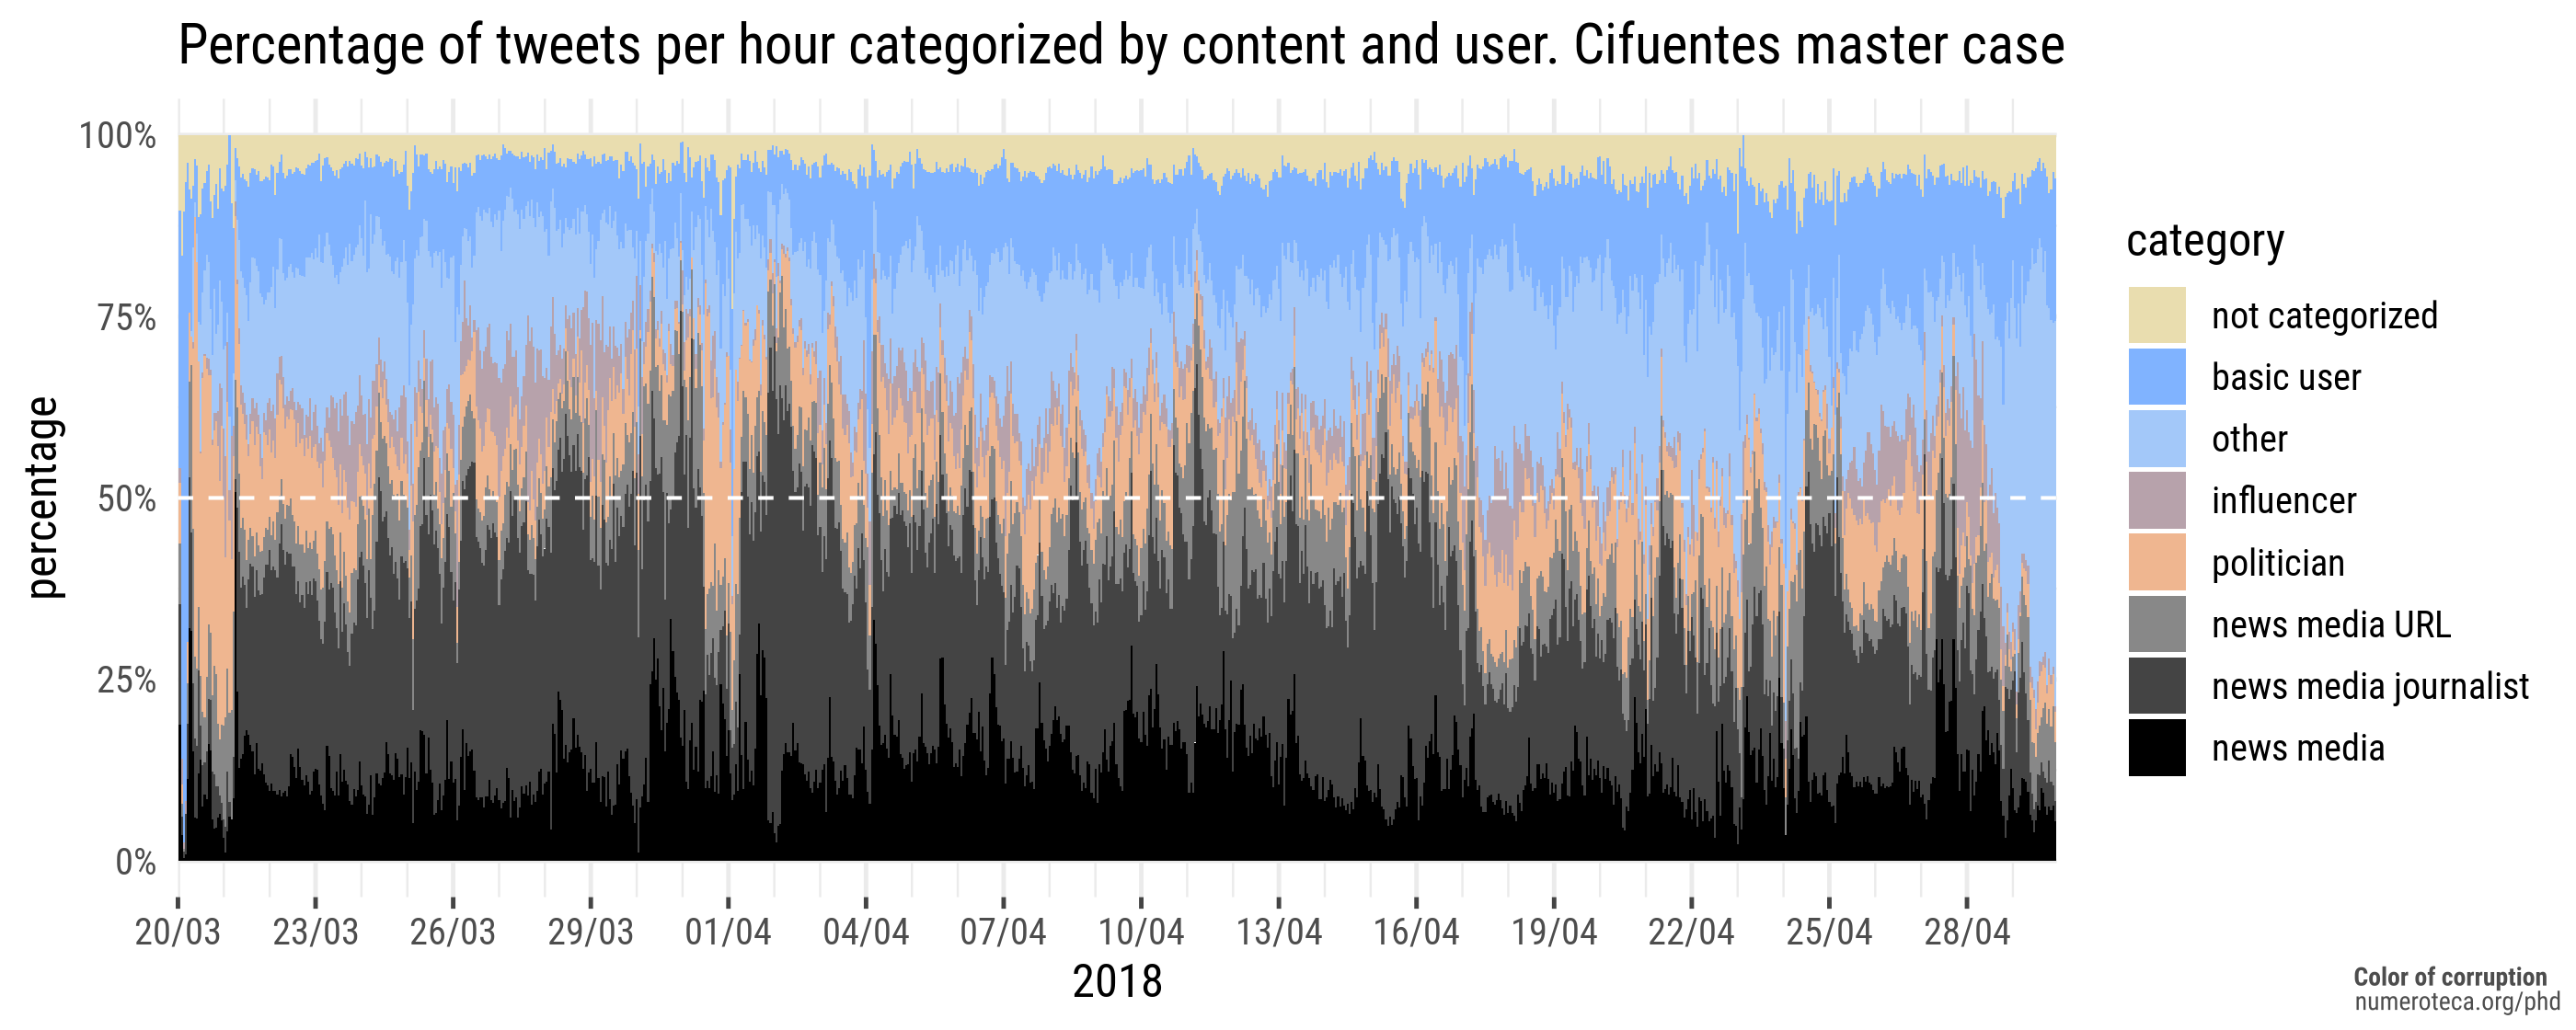
New online news sites and social networking platforms have consolidated their presence in the mass media ecosystem. In a polarized system, like Spain’s, where people select the newspaper that is more aligned to their ideology and point their attention to alternative sources of information such as social media, a question arises: what comes first, the agenda-setting and framing by mass media, or the general public predisposition? Are they simultaneous events? Corruption and corruption scandals are used in the longitudinal studies (chapters 8 and 9) to analyze how mass media have covered and framed them in the Spanish media ecosystem since the year 2001 to address these research questions. The analysis of a particular corruption scandal is used to measure the direct influence of news media in the Twitter conversation in chapter 10 (Fig. 3).
Spanish Corruption wave(s)
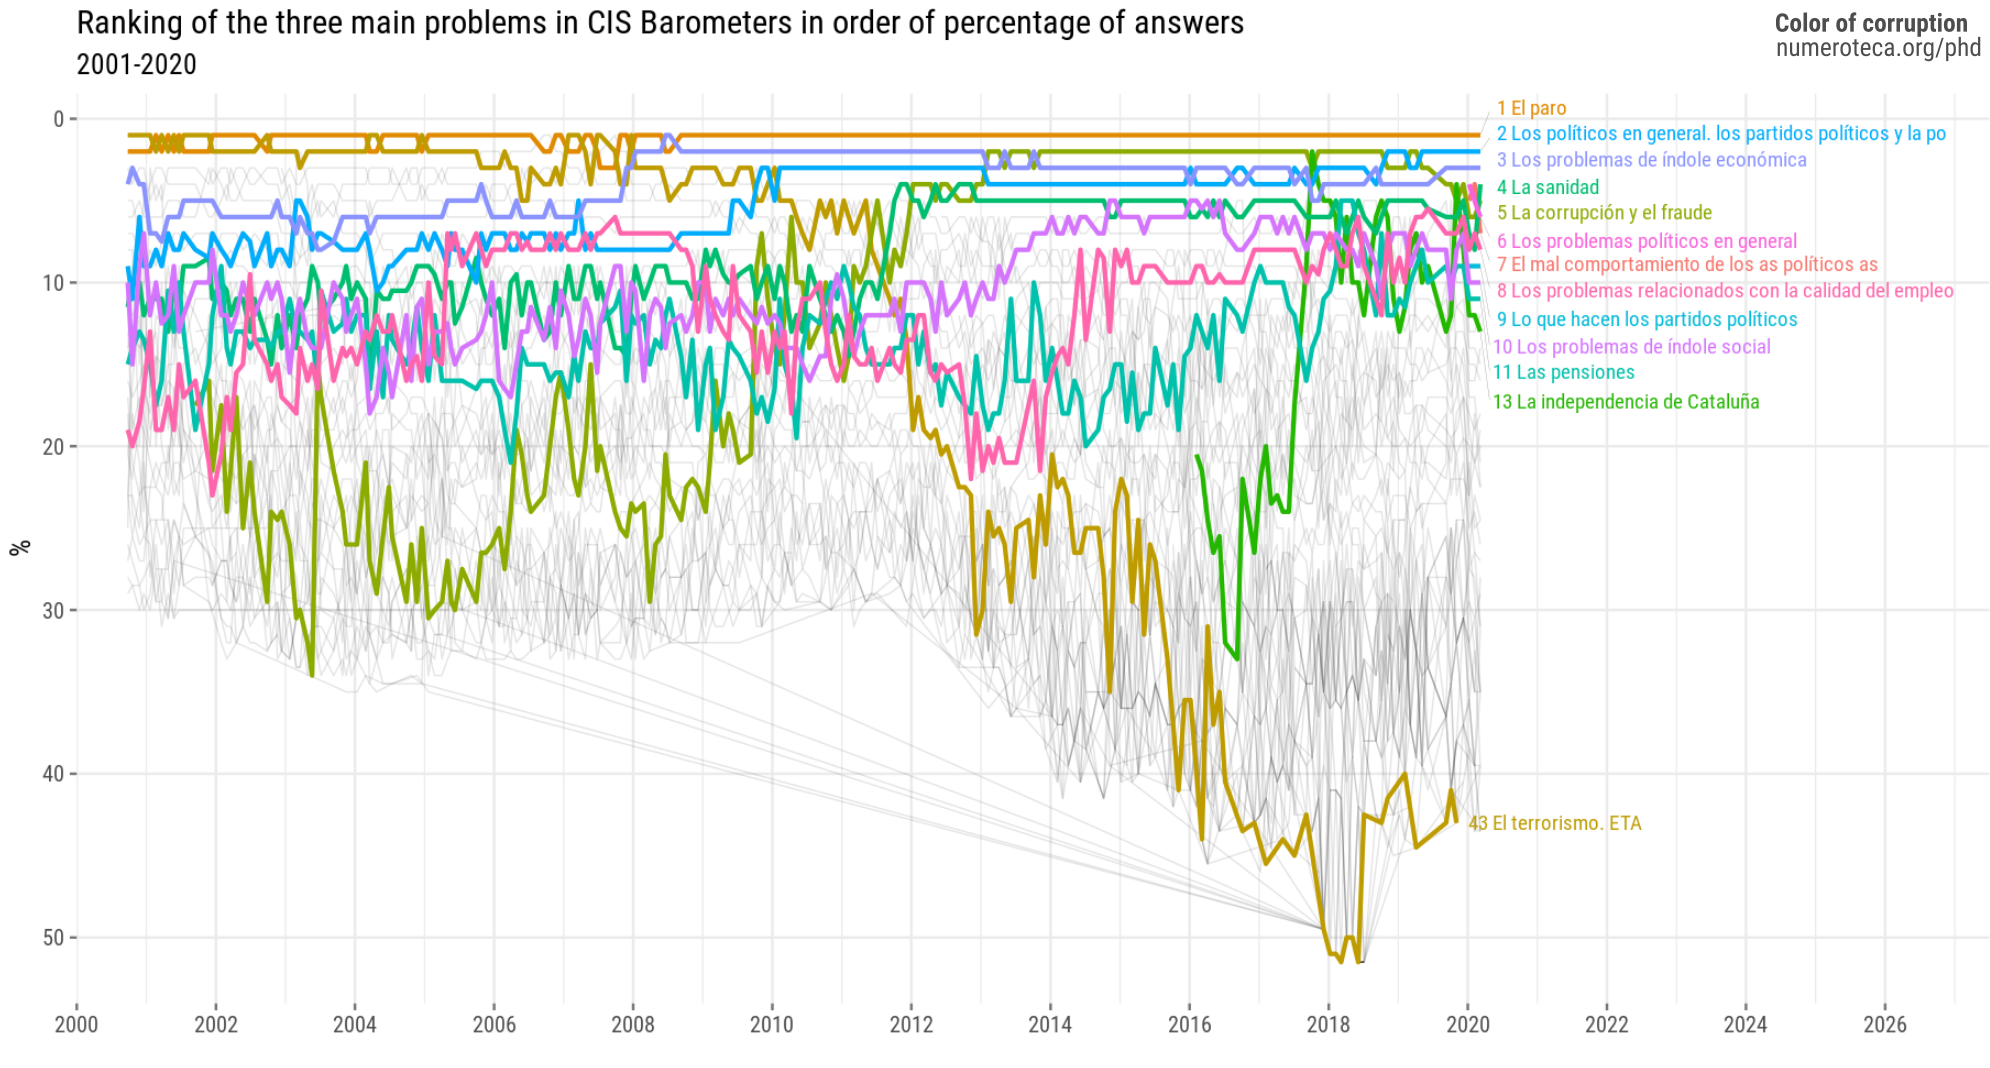
Corruption scandals in the socialist party –misuse of public funds and State terrorism, to name the main ones– were one of the main reasons that contributed to a change in the government in Spain in the general elections of 1996. The Centro de Investigaciones Sociológicas (CIS), a public research institute that conducts periodical public opinion surveys called “barometros”, documented the rise of corruption as a public problem during the first part of the decade. The second half of the 1990s saw a decrease in corruption perception as a problem. The new conservative government and the introduction of a new law that de-regulated urban zoning (“ley todo urbanizable”)4 changed public opinion concerns. In fact, corruption as an issue even disappeared as a classification in CIS Barometers’ open-ended answers to the question “which are the three Most Important Problems?” (MIP) for more than a year around 20015.
Years later, in the mid-2000s, corruption cases started to flourish again, or, more precisely, society started to know them thanks to the combination of media coverage and the action of the courts. Some corrupt activities had started years before, in the 1990s, as it would be known years later, but passed unnoticed by the news media and, therefore, to the public’s opinion.
After the Spanish real-estate bubble crashed (2007-2008) –the economic bubble that had fueled many corrupt activities in small and big municipalities in Spain (Costas-Pérez et al., 2012; Fernández Durán, 2006)– corruption scandals started to be known in an increasing rate (Davesa & Palau, 2013). After this wave of municipal scandals, a new set of corruption cases involved almost every institution in the country. The major political parties (PP, PSOE, CiU), the Royal Family, the main labor unions, the Supreme Court, the National Bank and many saving banks, just to mention a few, were involved in corruption scandals, usually brought to light by news media and amplified by social media.
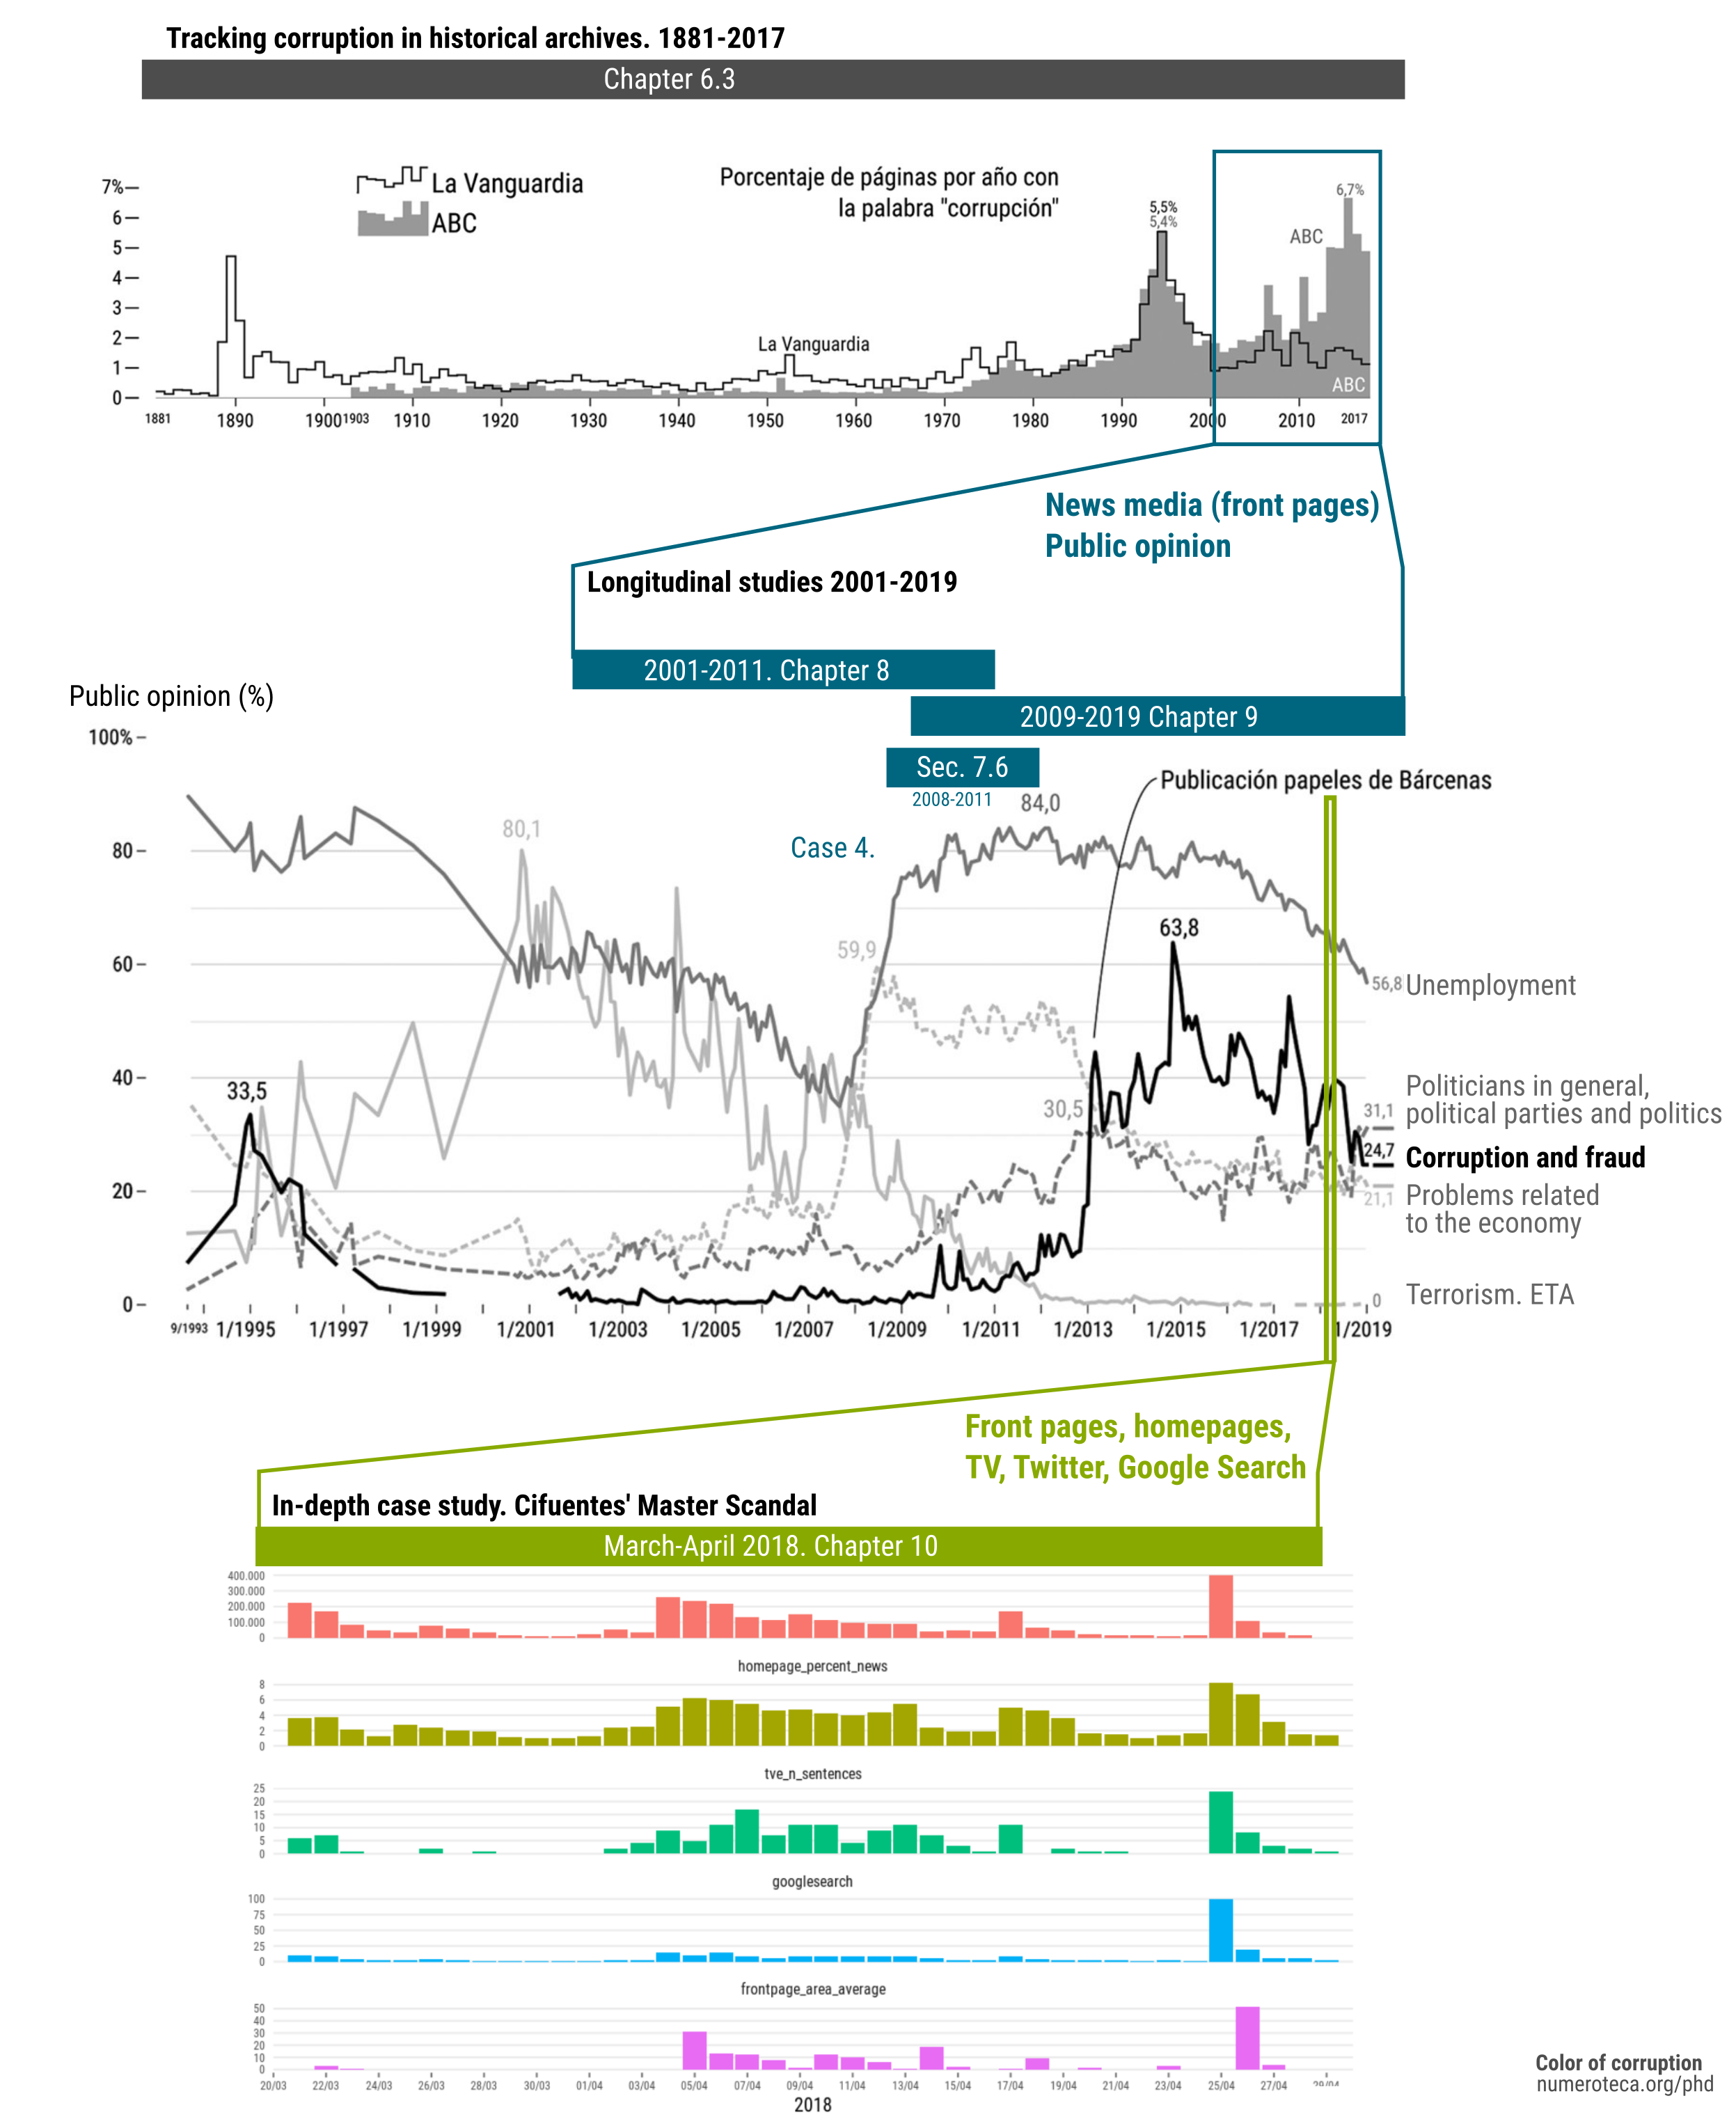
There was a time in 2013 and 2014 when a new investigation was unveiled every week, provoking an increasing sense of indignation in public opinion. This situation pushed the concern for corruption to the second position of the problems perceived by Spanish society in 2013 and stayed in that position for a few years. Since then, it moved some positions down, though it has been still in the top 5 until 2020 (in December 2019, it was in position 4, with 20.7% of the responses) (see Fig. 4).
Corruption, a good indicator for measuring media influence
People do not have direct experience with corruption scandals. In Spain, these scandals have been “mainly brought to light by newspapers”6 (Costas-Pérez et al., 2012). According to the existing literature, each issue in the news agenda –unemployment, war, inflation, or health, to name a few– has a different impact on how news media shapes public opinion in terms of time lag and transference of salience. The causes for this different impact are related to the issues themselves. Corruption, the issue selected for this research, is “unobtrusive”, i.e., it is considered that almost all the information people receive about it is thanks to news media coverage. That is why high levels of agenda-setting influence of corruption-related coverage are expected.
The wide range of actors involved in corruption scandals, the very polarized partisanship of the Spanish media outlets (Cardenal et al., 2019; Hallin & Mancini, 2004), and the unobtrusiveness of corruption as a public issue, makes corruption an appropriate field of research to analyze its influence among its readership (and viewership) and news media bias in Spain (Castromil, 2013). As stated above, the general public only learns about corruption scandals through the mass media. Because it is unobtrusive, corruption is expected to have more influence on the general public through the media than other issues that directly affect people (M. E. McCombs, 2004, pp. 60–61). As Zucker (1978) states: “the less direct experience the people have with a given issue area, the more they will rely on the news media for information and interpretation in that area” (p. 239).
Besides, quantifying corruption coverage in the leading newspapers allows analyzing how news media protect or attack certain parties and institutions by hiding or promoting specific stories. Through this analysis, it is thus possible to obtain accurate measures of their political bias. A Twitter analysis allows to research how social media dialogues with and modifies, and to what extent, the agenda-setting role of news media. Through this combined analysis, it is possible to update theories about the Spanish partisan and polarized media ecosystem (Bouza Álvarez et al., 2013; Hallin & Mancini, 2004; Rodríguez-Castromil & Chavero, 2012).
Corruption is used in this research to refer to the institutionalized or political aspect of the term and not related to petty crime and bribes. The definition of corrupt activities is open to multiple interpretations and changes. It is challenging to define them precisely, especially in the context of liberalization and privatization processes (Johnston, 2005; Jowitt, 1983; Wedel, 2001). Drawing from Villoria & Jiménez (2012), corruption is considered, for the scope of this research, as the abuse of power with direct or indirect benefit with non-compliance with legal norms.
Scandal is used here as “the intense public communication about a real or imagined defect that is by consensus condemned, and that meets universal indignation or outrage” (Esser & Hartung, 2004, p. 1041). It is important to stress that the cause of the indignation might be real or not (i.e. the accusation of corruption could be fake-news), but the fundamental issue is if it receives enough attention, usually measured by intense news and social coverage or response to the scandal7. Not all corrupt activities are detected and published by the news and social media. Even if they are, only heavily mediated stories reach the status of scandals and are known by most of society.
1.3 Research design and methodology #
This research is based on an empirical methodology that includes developing data gathering tools and analysis techniques for news and public opinion data. Where they did not exist, I had to build news and social media databases, like in the case of homepages of news sites or tweets. In other cases, published data sets are used, and what has been developed are the analysis and visualization tools for the content, like for newspaper front pages or television newscasts. In a few cases, this required repeated requests of databases that could not be accessed despite their theoretically public nature until they were published in open and accessible formats, like with the “Rational vote and media agenda” (Q-ÍNDICE, 2006) from CIS.
All these datasets of different sources form the basis for all the case studies (see Fig. 5). Each consists of visual and statistical explorations to compare and calculate correspondence, similarities, and correlations among news coverage and public opinion, as well as intermedia agenda-setting effects among news outlets and media channels.
They are accompanied by a review of the existing literature about agenda-setting theory and related theories, social media analysis, and the context of news media and corruption in Spain in the past three decades. Additionally, four semi-structured interviews have been conducted with newsroom editors of Spanish news media to contrast the evidence extracted from the data analysis (see the list of interviews and transcripts in Sec. 14.2.7).
Case study selection
The election of corruption as the main issue to study the public and news agenda obeys various reasons. In the first place, corruption is an unobtrusive issue, so it is expected to have more influence on the general public through the news media than other issues that directly affect people, or that can be known through other ways. Second, it has been studied before by other researchers for the period 2001-2011, so data sets were available, which enabled the comparison of different research techniques. The availability of public and accessible datasets and databases was also critical for this selection, which enabled the possibility to conduct these analyses and the comparison of various research methodologies (see Sec. 7.6 Three methods of front page analysis compared). Third, it was a high salience issue in Spain’s public and news agendas, mixing periods of low, medium, and intense (and continuous) coverage in the past two decades8.
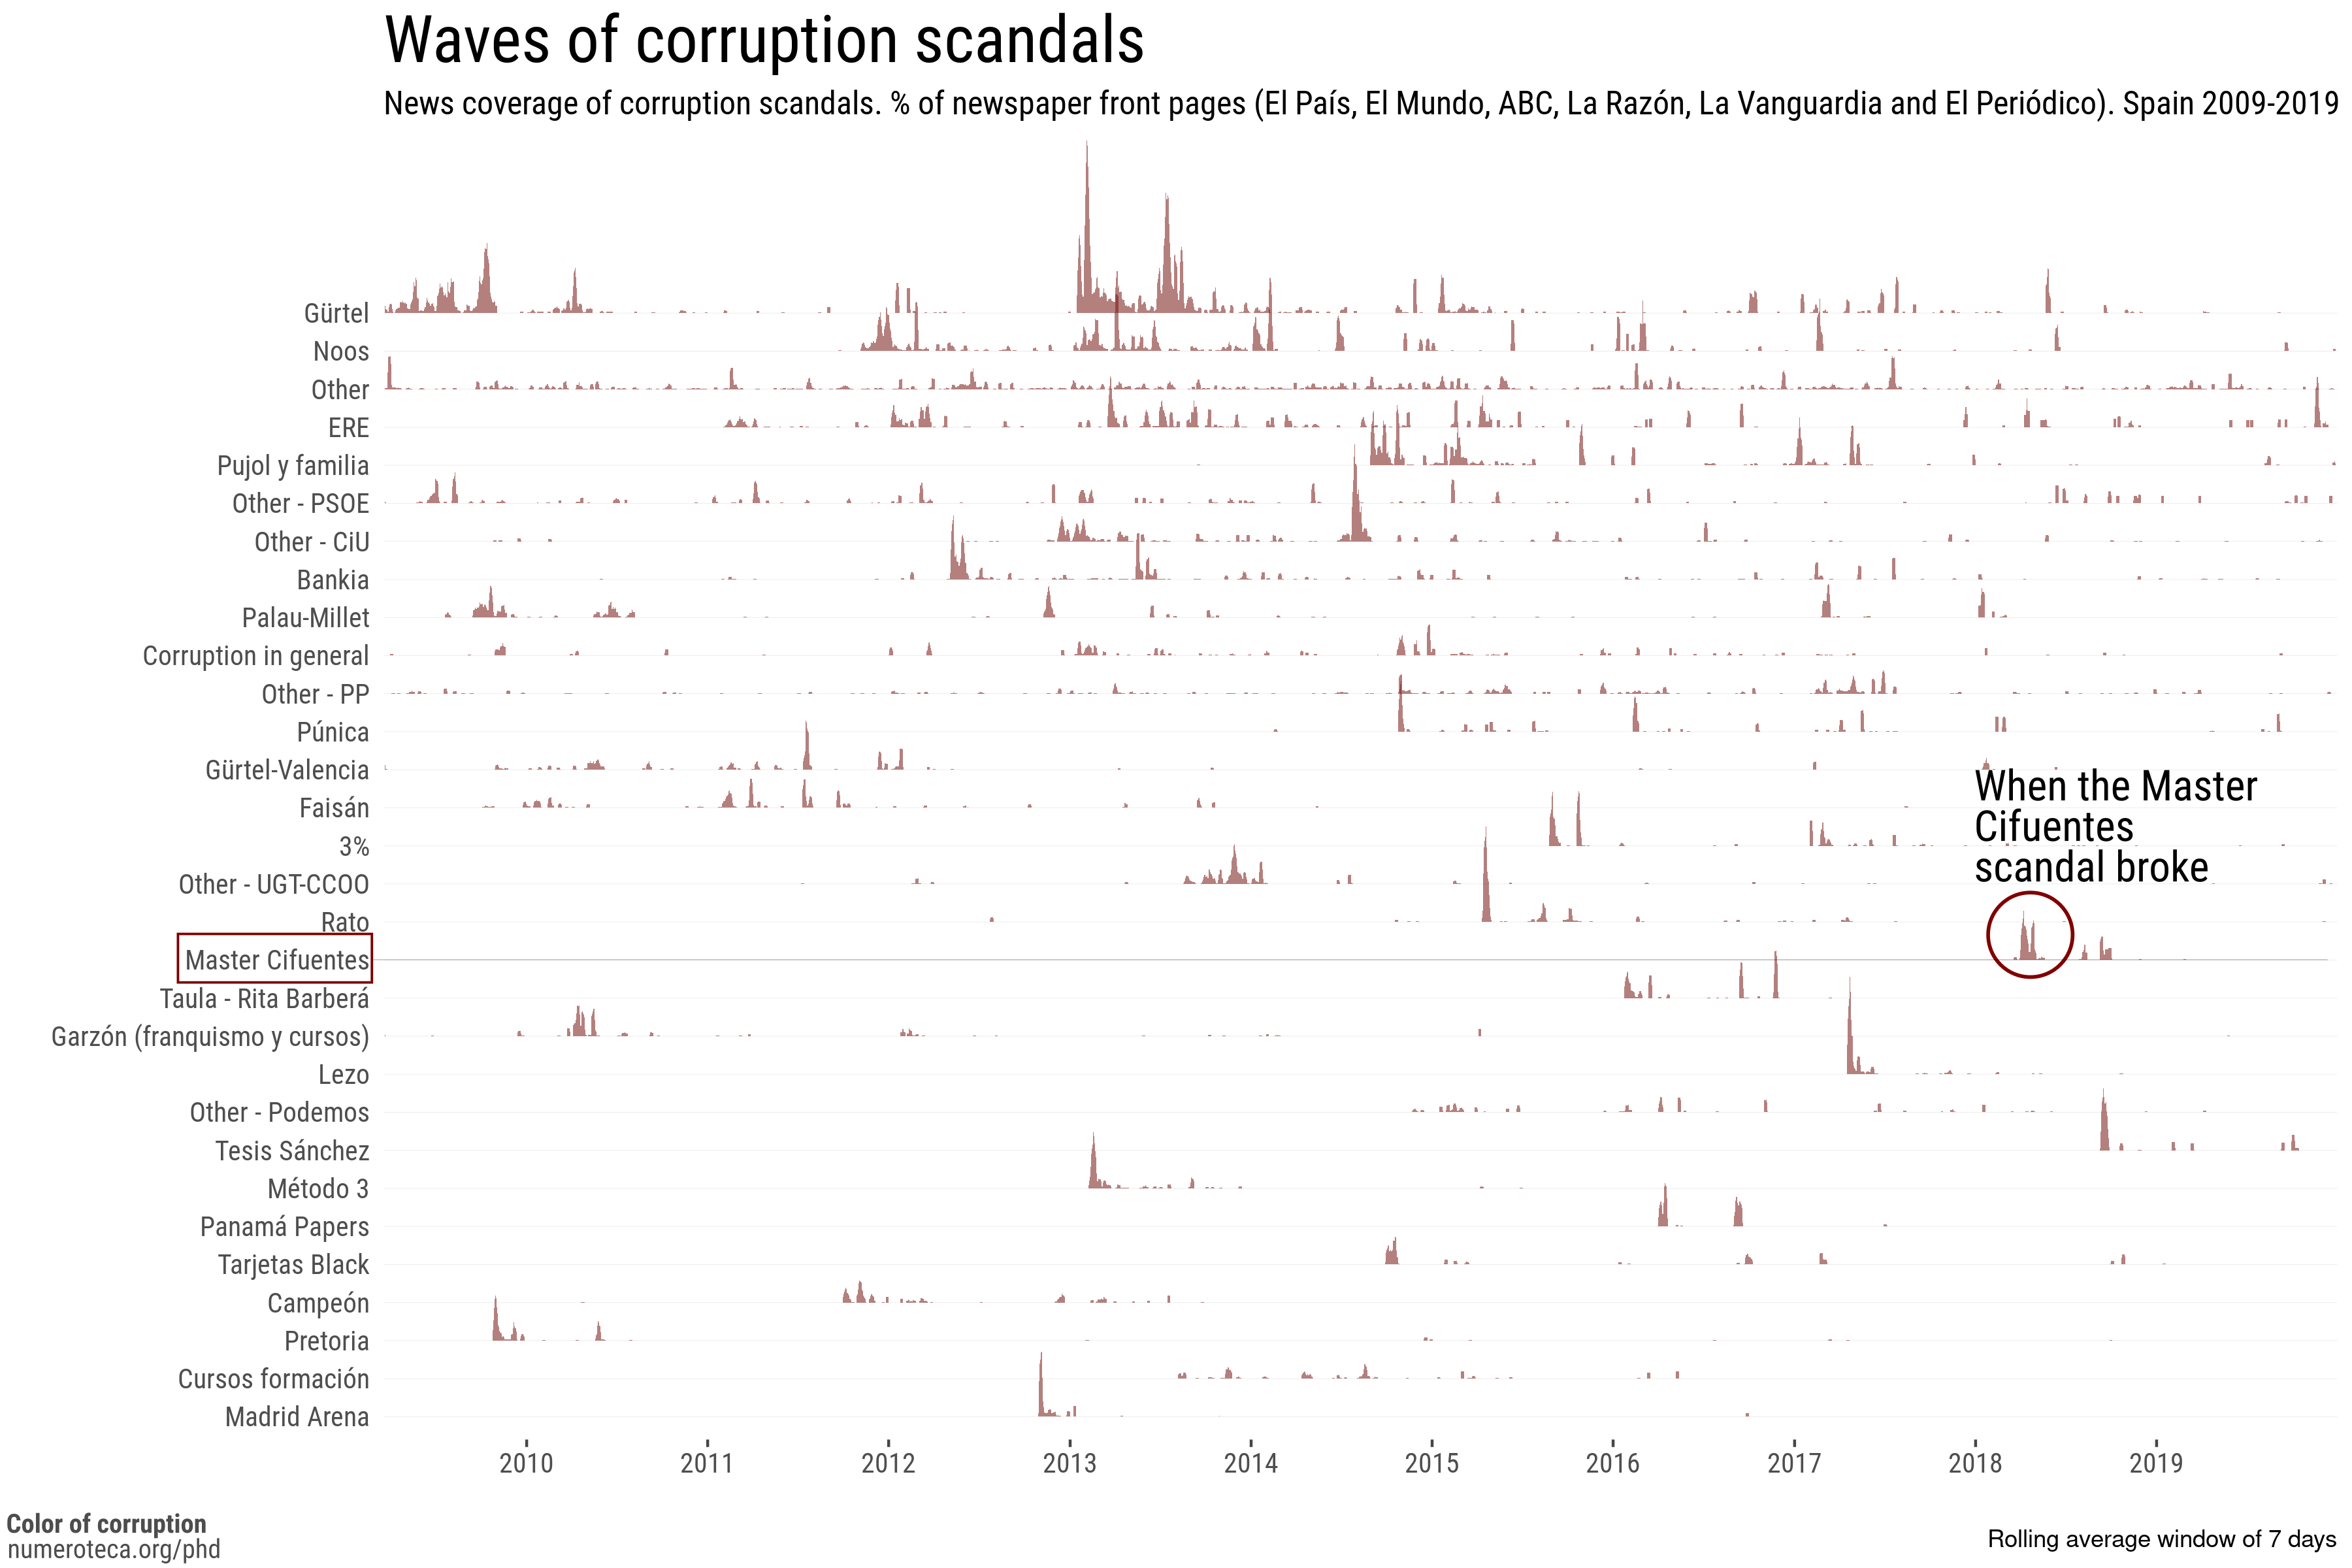
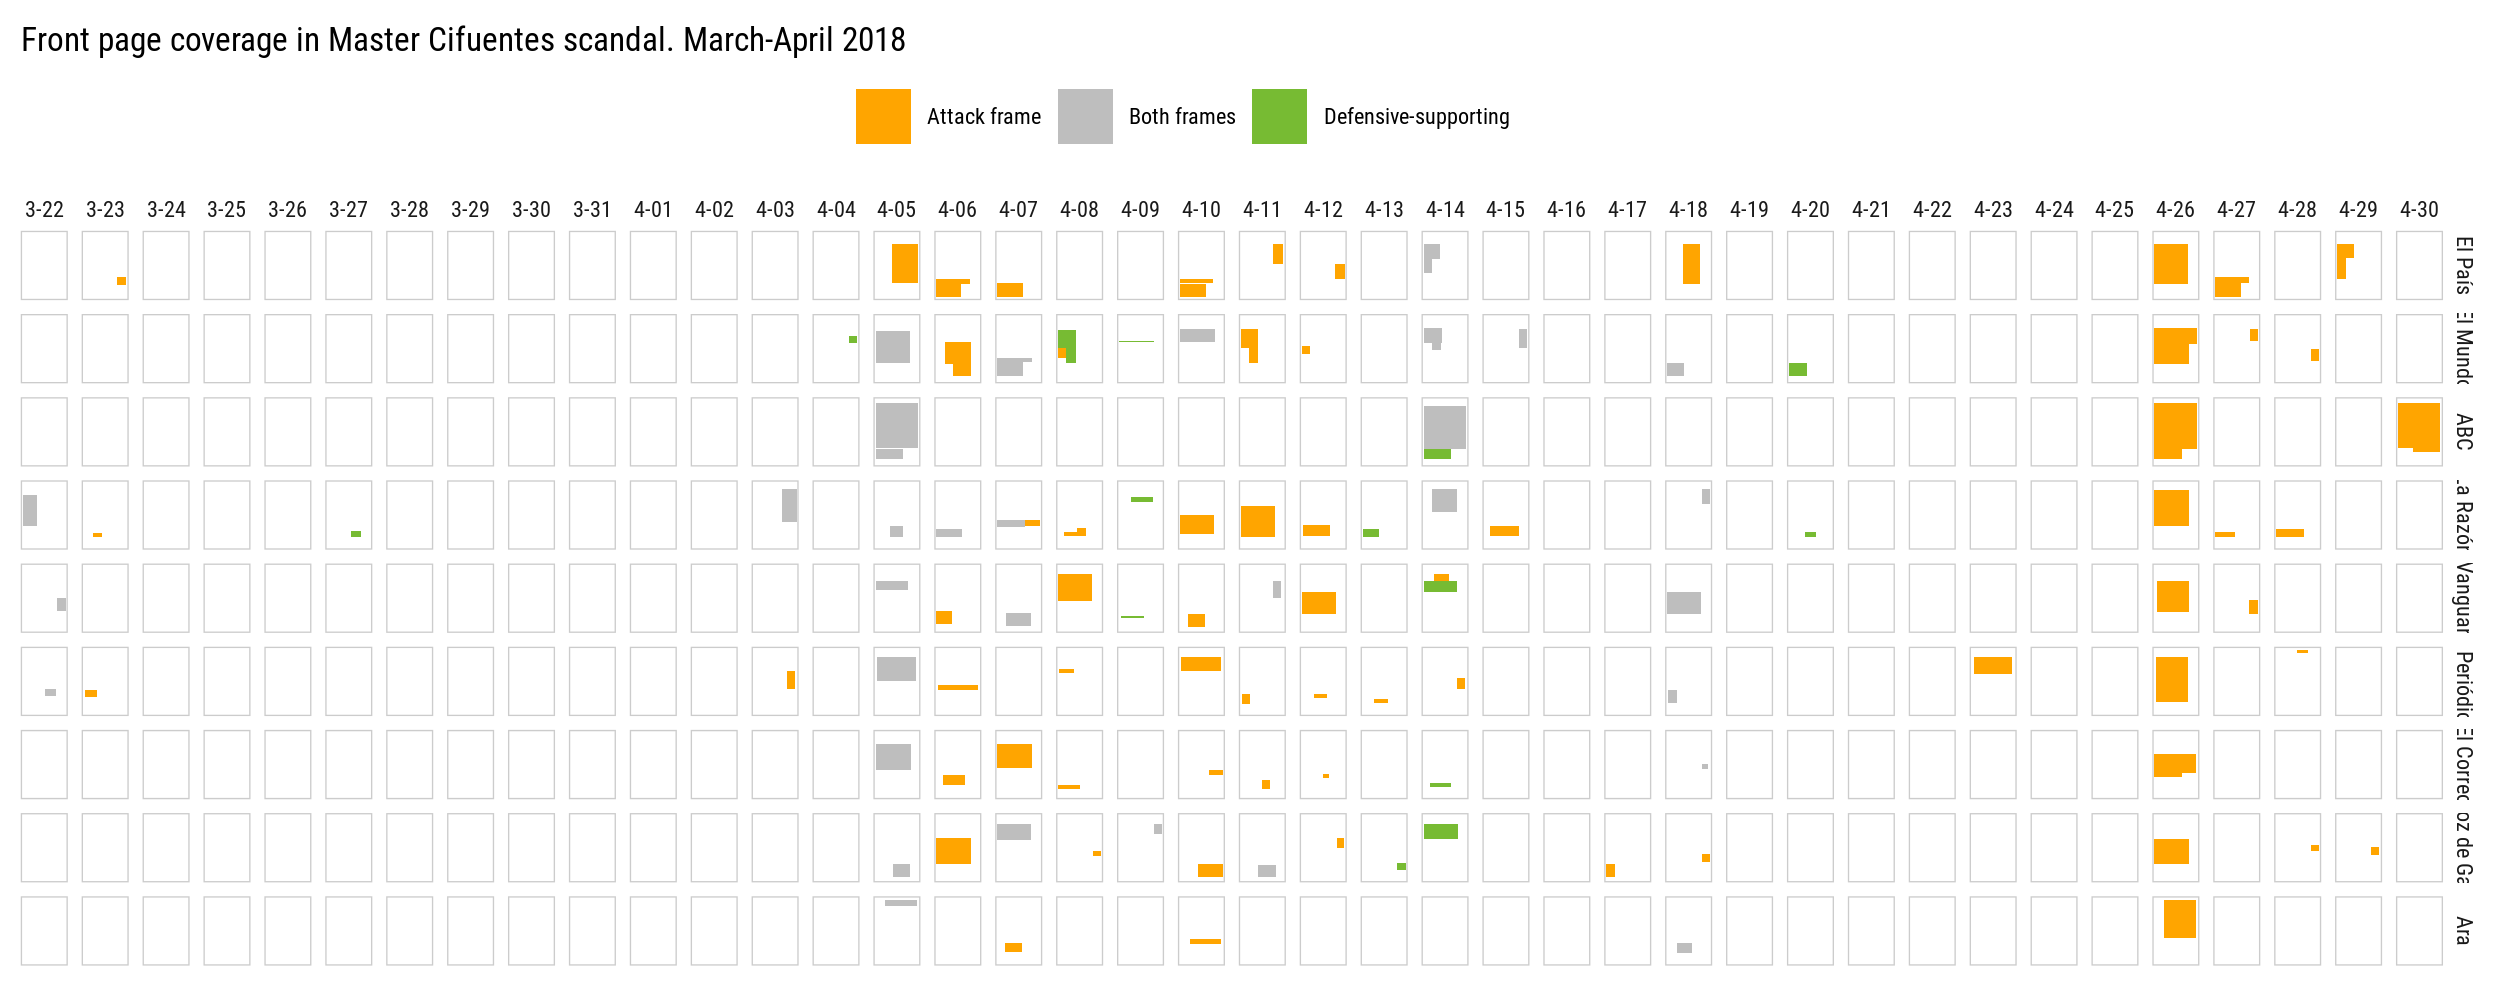
Given the high number and diversity of corruption scandals, the choice of the Cifuentes’ Master scandal for the in-depth multi-channel case study was based on various reasons. First, it was one of the biggest political corruption scandals in the last years of the 2010s decade, regarding the amount and intensity of news coverage9 (Fig. 6). Second, it unfolded in six weeks, making it an “affordable” time to conduct analysis compared to other scandals where the developing phase took months. The last reason, and no less critical for the present research, the mass media data tracking tools (for Twitter ane home pages) were already set up.
The Cifuentes’ Master corruption scandal was by no means the worst in terms of economic fraud or the number of politicians involved. However, it had all the ingredients that made it an ideal ground to test our hypothesis and working methodologies.
Data gathering tools: as close to readers’ experience and as less sub-sampling as possible
In this research, the goal is to reproduce the ways news are received by the people or to provide the closest approach to it as possible. In that sense, the total amount of articles published in a certain period is not used, like many using Lexis Nexis databases, but instead, for example, the number of news stories available and at reach on the home page of online news sites. It is more relevant to the reader/user the amount of available-easy-to-access information than all the published news stories that cannot be accessed easily. I consider this a more accurate measure of what news media consider important and what readers can access. Communication only exists if someone receives and understands the message; the act of sending it does not constitute communication (Luhmann, 2000).
Together with this approach, the relative amount of information published is used instead of just the amount. It is likely to provide a more nuanced measure of the salience provided by the media to a story or topic.
To remove from the equation the problem of sub-sampling, or at least to reduce its possible impact in the results, the guide to design the data collection and visualizations has been to gather and analyze as much data as possible without previously selecting which content to analyze.
Looking for visual evidence
“Modern data graphics can do much more than simply substitute for small statistical tables. At their best, graphics are instruments for reasoning about information. Often the most effective way to describe, explore, and summarize a set of numbers – even a very large set – is to look at pictures of those numbers. Further more, of all the methods for analyzing and communicating statistical information, well-designed data graphics are usually the simplest and at the same time the most powerful”.
Edward Tufte. The visual display of quantitative information. 2nd edition (2001)
This dissertation is strongly based on data visualizations, or data graphics, as Tufte (2001) calls them. Data graphics are employed to better process and understand complex numerical results. They are used for data analysis at the same level of importance and relevance, sometimes even higher, as the numerical statistical results with which they are compared.
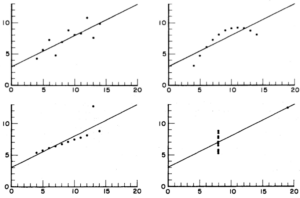
In the literature, correlations are often just summarized by a number (e.g. +0.789) without an adequately exploring its graphical representation. Anscombe’s quartet is an excellent example of what could happen if datasets are not correctly analyzed graphically. Four datasets have the same statistical description (means, standard deviation, correlation coefficient) that mathematically adjusts to the same linear model. However, when explored visually (Fig. 7), they reveal very different relations in the two data series compared in each dataset (Anscombe, 1973).
The present research uses many existing data visualizations –time series, histograms, scatter plots, Sankey diagrams, network graphs, graphical enriched data tables, and small multiples that integrate the former– and explores new combinations of existing ones. This explains the high number of figures (over 600, not to mention others used during the research but not appearing in this document, in the Annex, or the ones available on the dissertation website). Graphical analysis is understood in the present research as an intrinsic part of the research exploration, not just the final result. Also, the caption of the image often offers insights not present in the text. Sometimes a chart is repeated along the text for the sake of readability.
The new graphical analysis tools developed for this research, like the front page analysis with Pageonex small multiple charts, pianola roll charts for home page analysis, and the correlation Sankey diagram for intermedia setting analysis, contribute to expanding mass media and agenda-setting studies in new directions.
The high number of pages in this research is partly a result of the use of explanatory data visualizations, which involve the use of multiple versions of the same chart to make the argument. To exemplify the use of graphical tools in this dissertation, the infographics that follows (Fig. 8 and 9) serve as a visual guide to the case studies performed and a summary of the case studies of this dissertation.
Methodological innovations: Measuring mass media and public opinion
When designing this research, I realized that the specific tools I needed for data gathering and analysis of specific mass media channels did not exist. Various data gathering, processing and analysis techniques needed to be developed to address the research requirements (see list of data gathering and content analysis techniques in figure 10).
Mass media channels
Measuring news media coverage in the digital era has to deal with the multiplicity of channels and the vast amount of data needed to apprehend the current media ecosystem. To measure is to select which aspects of reality are to be studied. For digital objects, this is an even more relevant question: in the past, researchers had only to decide which media sources to gather (local and national newspapers, television, radio, or magazines), which was (to a degree) simple, since a front page or a video recording are almost immutable pieces of information that self-contain all the information the researcher needs, except for a few metadata not available in the recording itself. However, the content and look of an online news site page in a given moment depends on the device where it is displayed or the user’s cookies, to name just a few critical modifying characteristics. A visit to the same website a minute later could result in a very different experience, as they are continuously updated spaces. Besides, home pages, the same as tweets, are digital artifacts and are not as simple to preserve as single images or video files. If any dataset simplifies reality, this process is even more pronounced for digital media.
As already mentioned, researchers have counted articles or measured surface area or news stories on front pages for a long time. Generally speaking, they have used, for online news sites, the total number of articles published by the news outlet instead of the selected articles on the front page. It is usually a question of the availability of the sources, and many researchers depend on existing archives of news stories to design and make their analysis. The approach for this research has been to develop the tools to build the databases needed where no data were available and use existing tools and datasets if they existed.
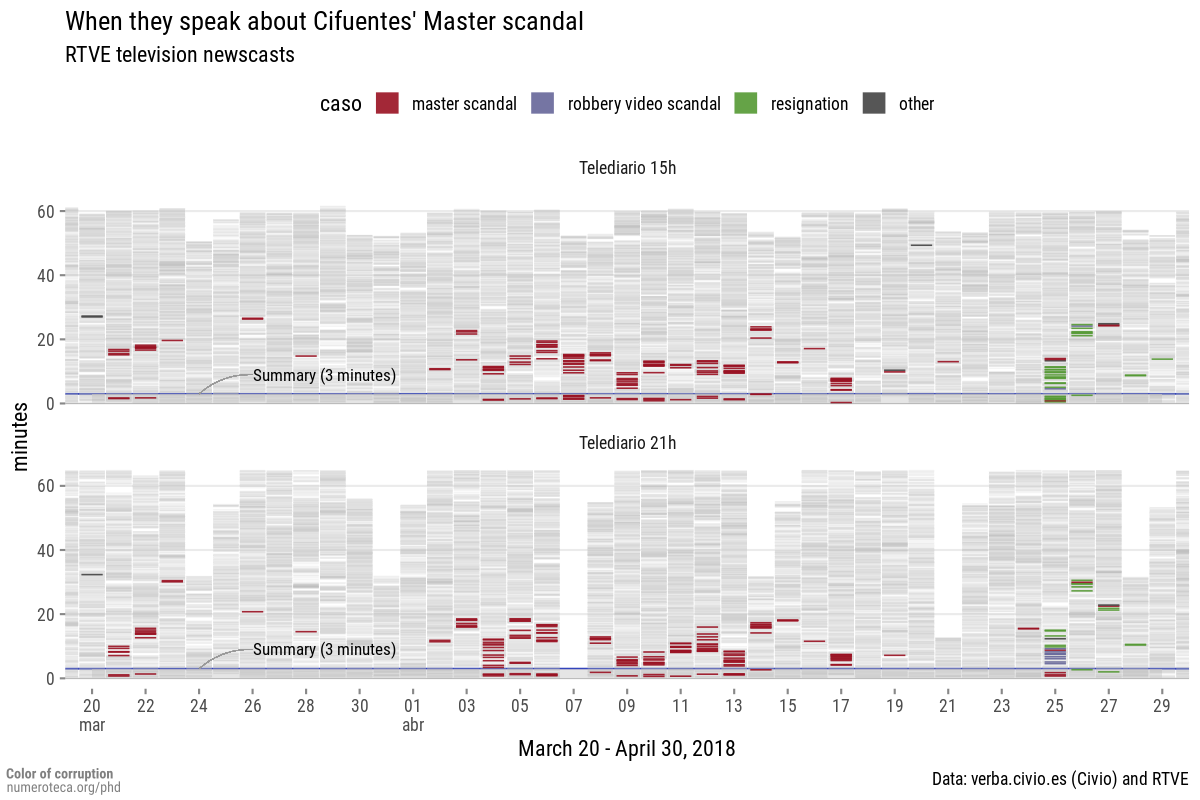
For example, Homepagex software was developed for the news sites’ home pages analysis (Fig. 11). This tool archives the various news sites’ home page HTML code hourly, parses its content to find the headlines, and represent the evolution of position of all related stories (based on a multiple word search query) (Fig. 12). It is used for the in-depth case study in section 10.3. With the same aim to adequate visualization analysis to the each media channel, for TV newscasts, the units of analysis are the sentences. Another multi-word search query is used to find the related sentences and represent the, to see when in each newscast they talk about the researched topic (see figure 13 and Sec. 10.4).
Public opinion
For public opinion analysis, the evolution of the principal public agenda issues is measured through periodical polls. For this research, the answer to the MIP question in public opinion surveys from the CIS– similar to the Gallup polls for the USA– is used to track the evolution of the most important issues. As a contrasting dataset, Google Search data are used to compare people’s direct reactions to events and stories.
Agenda setting
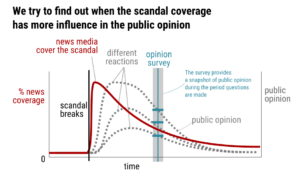
A combination of visual and statistical methodologies is employed to study the agenda-setting effect of the mass media ecosystem on public opinion. For example, the longitudinal studies are first-level agenda-setting analyses; the first step has been to compare the timelines of news coverage visually using different rolling average windows to the public opinion answer to the MIP question. Then, scatter plots are used to visually detect relations in isolated pairs of data news↔public opinion, followed by the calculation of multiple correlations and by their comparison along multiple variables: the day of the survey to calculate previous news coverage, the span of the correlation window, news correlation rolling average window, groupings of newspapers to calculate news coverage or type of correlation (Pearson and Spearman). Figure 15, is a summary of the visual and statistical operations in longitudinal studies 1 and 2:
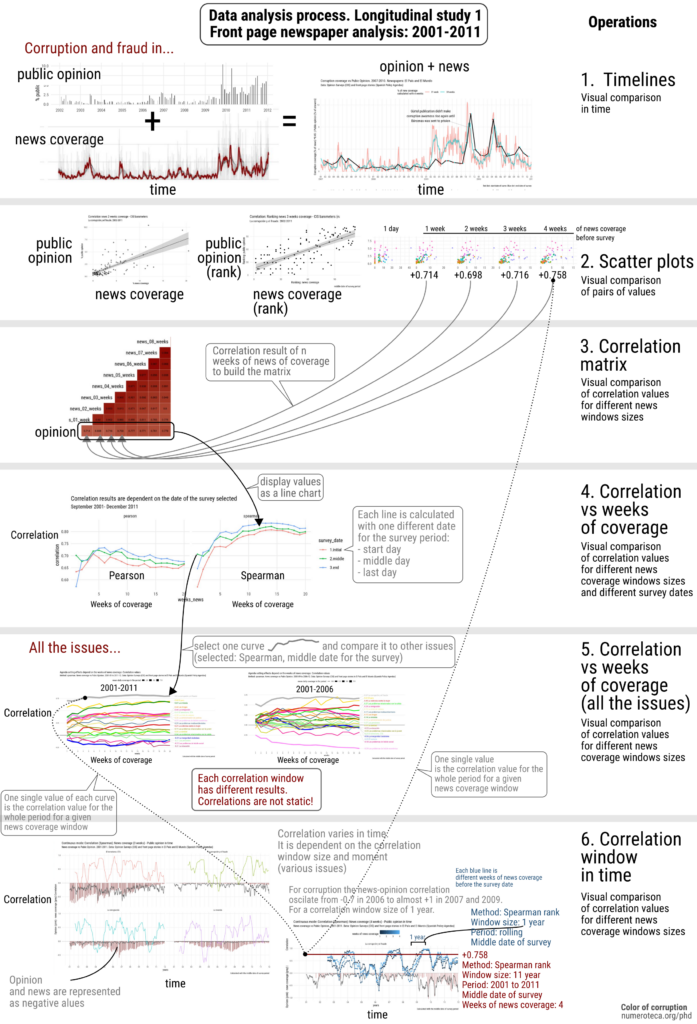
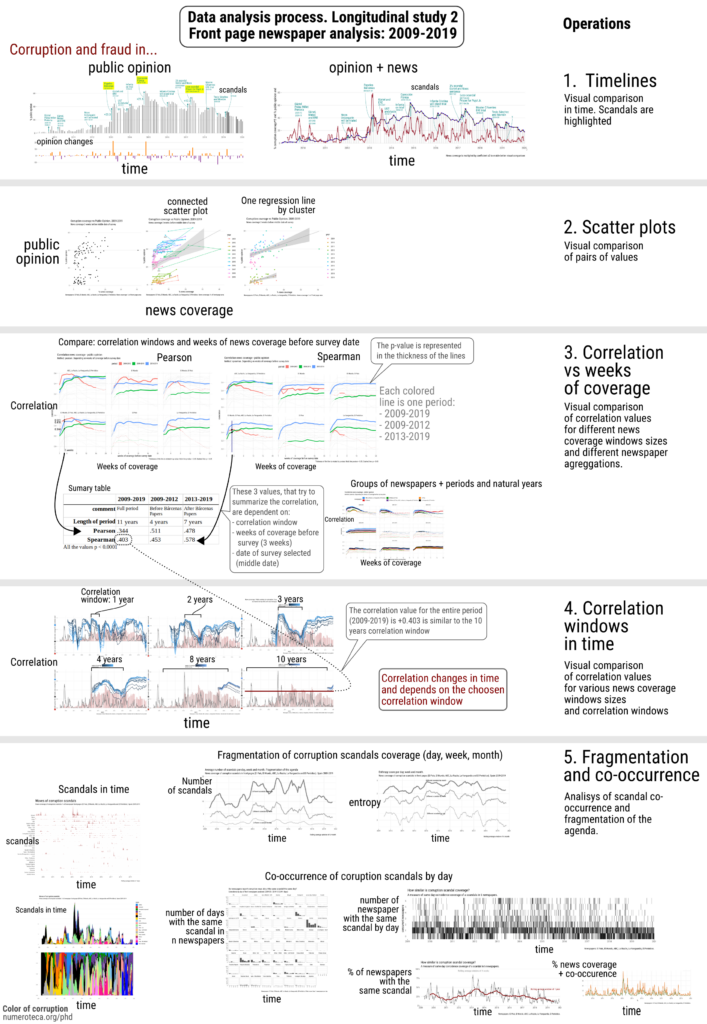
Data visualization is also used to explore systematically different correlation results and methods to analyze how they change when studied and compared to other variables. Various correlation windows and rolling correlation are analyzed as well to show the limitations of this type of analysis. The statistical significance (p-value) is also used in various data graphics to represent visually statistical significant .
A set of complementary measures have been used to enrich and nuance the interpretation of the agenda-setting analysis. These metrics account for the fragmentation of the corruption news agenda and co-occurrence of scandals across the media ecosystem, to cite some of the most important.
Hypothesis and objectives
The motivation for this work of research is to understand how the current mass media ecosystem works regarding intermedia relationships between news and social media channels. The key contributions are: (a) at the theoretical and methodological level, an exploration of the potential of data visualizations methodologies for agenda-setting studies; (b) at the empirical level, to find out if (and how) the news coverage of corruption influences or modifies public opinion, with the goal of clarifying how persuasive the mass media ecosystem is; (c) at the instrumental level, to develop new data collection, analysis and visualization tools; (d) at the ethical level, to make data collection, analysis and visualization tools, together with the gathered data, open and available.
The research hypothesis of this research are three: (H1) news media have a strong agenda-setting effect in public’s opinion, specially related to corruption stories; (H2) mass media’s influence on public opinion is more effective in the short term (i.e. days); (H3) social media media does not have a relevant influence in the configuration of the public agenda, traditionally/usually set by the news media.
The objectives of this research are (1) to explore the potential of the before mentioned innovative techniques of data gathering, content analysis and data visualization, (2) to compare these techniques to those used previously that are described in the literature, and (3) to contribute to the theories about the agenda-setting role of news and social media on the public agenda in the current online-mobile-social-multichannel media ecosystem. See chapter 5 for more details on the hypothesis, objectives and research questions.
1.4 Dissertation structure #
The dissertation is organized as follows:
- Part I. Theoretical framework
- Part II. Research design and methodology
- Part III. Fieldwork, analysis and results
- Part IV: Conclusions and future work
This first part deals with the existing literature about the main theoretical frameworks related to this research. Chapter 2.Mass media and public opinion explains the theoretical framework on the state of the art in the literature of agenda-setting and media studies in the current offline – digital media ecosystem. It focuses on the characteristics of the mass media channels (news and social media) and the approaches to analyzing them. The chapter ends with a review of agenda-setting theory and sub-theories, like framing and intermedia agenda-setting. Chapter 3. Corruption and corruption scandals addresses the specifics of studying corruption as a public concern issue. It reviews the existing literature, with particular emphasis on corruption scandals as intensively mediated events. The first section of chapter 4. The Spanish Setting provides context to the evolution and structure of the Spanish mass media ecosystem, mainly focused on the last two decades. The primary databases and metrics of mass media consumption are described to set the basis of the following case studies. The second section is dedicated to reviewing the history of corruption in Spain in the last two centuries, especially in the past decades since the Transition in the 1970s.
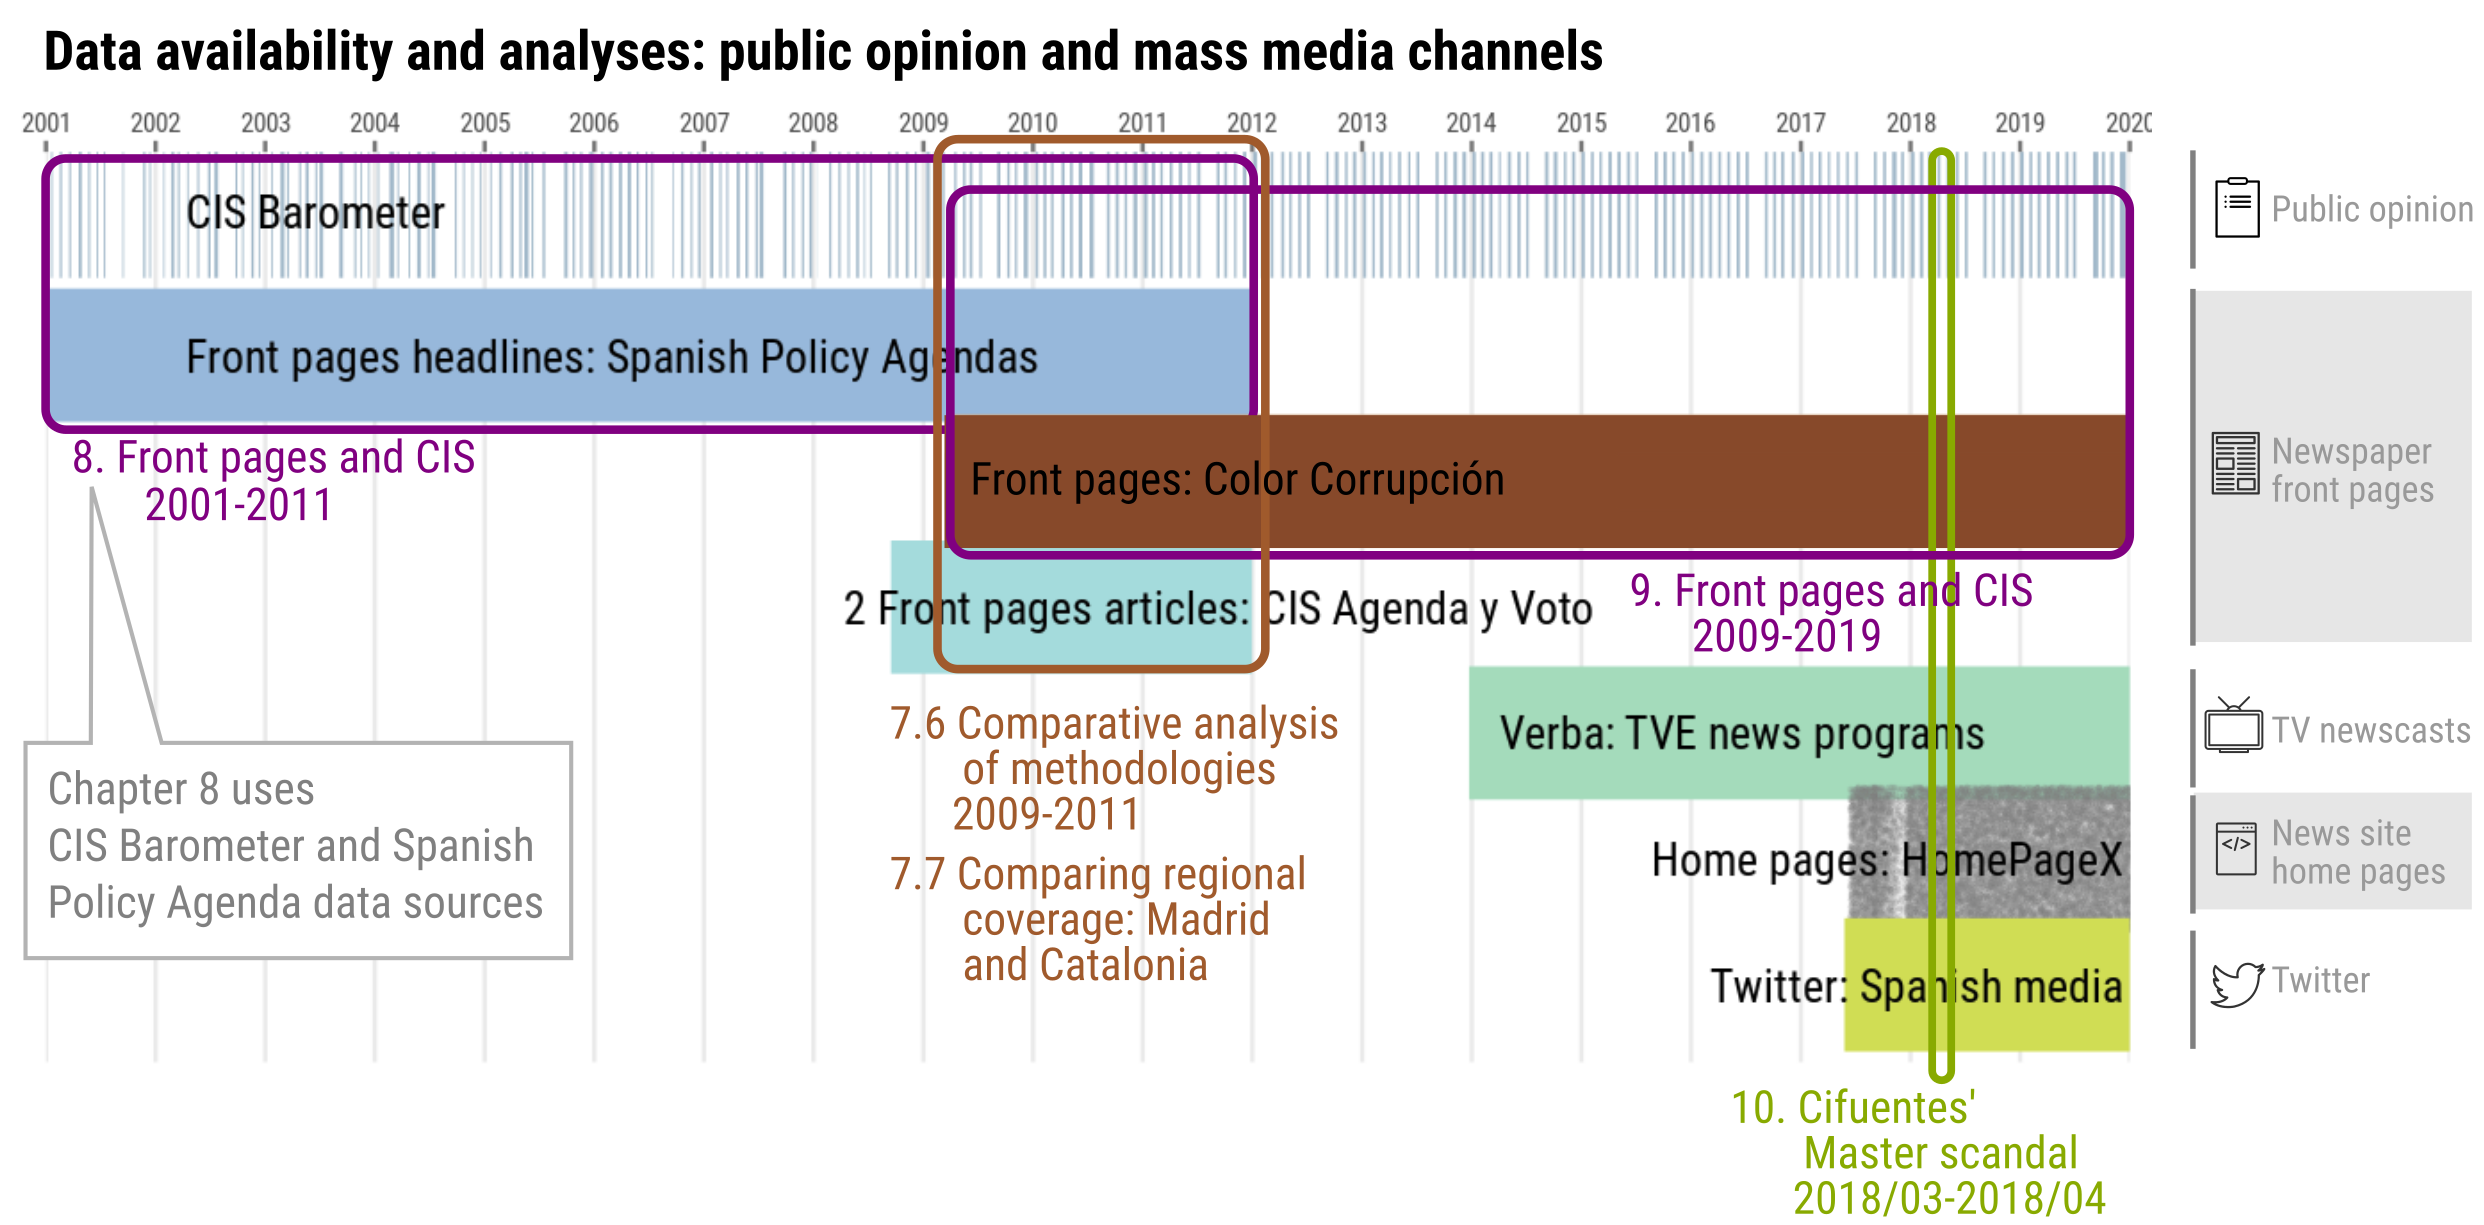
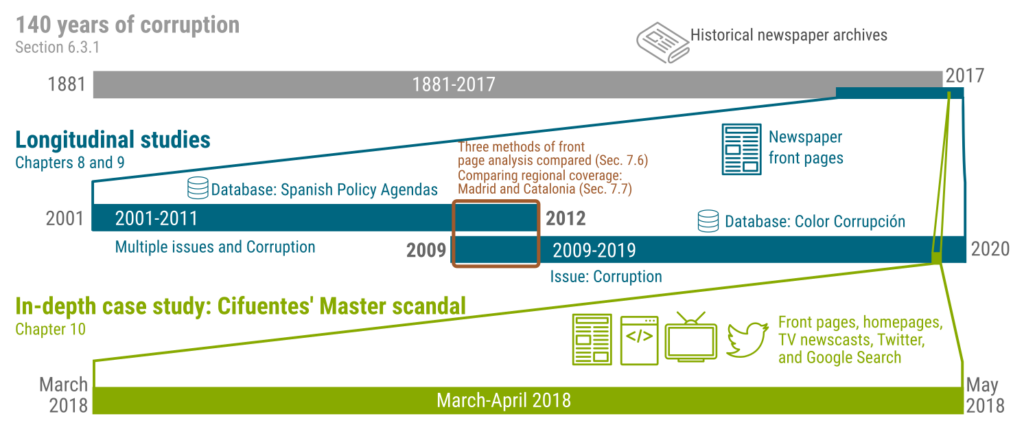
The second part is dedicated to explainig the Research design and Methodology. It introduces the research questions and hypothesis in chapter 5. Objectives, hypothesis, and questions and argues the main features of the empirical research design ,a multi-channel analysis based on visual and statistical evidence. Chapter 6. Indirect measures of corruption (in Spain) explores different approaches to corruption measurement in the Spanish context. First, it exposes the limitations and problems –the impossibility of obtaining and processing publicly available corruption data from different judiciary institutions in Spain. Second, it analyzes different public opinion surveys –perceived versus direct experience with corruption– and provides an overview of the evolution of public opinion in Spain according to CIS Barometers. The last section examines news corruption coverage in a 136 year long case study of corruption coverage in two Spanish newspapers. This basic semi-automated analysis provides the first basis to track corruption as a public issue with news coverage metrics.
Chapter 7. Research design: tools / instruments argues the main features of the empirical research design. The two principal methodologies are presented: agenda-setting analysis in the longitudinal studies and intermedia agenda-setting in the in-depth case study. The databases section(section 7.5) explains how data from mass media channels and public opinion have been collected, processed, visualized, and analyzed for this research, combining existing and new (original) tools and databases. The databases include front pages, home pages, television newscasts, Twitter, and Google Search. The particularities of CIS barometer public opinion surveys are examined, especially the “three most important problem” question and the micro-data. Together with the mass media channels databases, a series of semi-structured interviews with news media editors of the leading Spanish news media are presented. As various existing and newly developed databases share the period 2009-2011, I use these years to compare different methodologies for front page’s news coverage analysis (Sec. 7.6). Finally, a comparison of corruption coverage and public opinion is performed to study if distinct local news coverage can affect public opinion (Sec. 7.7).
The third part purpose is to explain the Fieldwork, analysis and results. Chapter 8. and 9. areyears-long agenda setting. They are two 11 yearslongitudinal studiesthat analyze corruption coverage and public opinion in the past two decades in Spain. Both news coverage data sets are compared with CIS Barometers public opinion data to study agenda-setting effects. The first, chapter 8. Longitudinal study 1. Front page newspaper analysis: 2001-2011 uses an existing database that classifies all the front pages news stories of two Spanish newspapers by issue. This case study analyzes agenda-setting role of news coverage in the public opinion for corruption and other principal issues of the agenda (chapter 8). The second, chapter 9. Longitudinal study 2. Front page newspaper analysis on Corruption: 2009-2019 uses a novel news database related to corruption on the front pages of six Spanish newspapers developed for this research (chapter 9).
The closing case study shifts from a longitudinal approach through the years perspective to measure tweets or news headlines by the minute. Chapter 10. In-depth case study:the Cifuentes’ Master scandal consists of a detailed analysis using all the media channels explained in the methodology (front pages, home pages, television news, Twitter, and Google Search). It is centered on the first six weeks of the scandal (March 20th – April 30th 2018) since the story broke and serves to analyze in detail how the different pieces of the mass media ecosystem interact with each other. Each media channel is analyzed together with the comparison among news media outlets and the interactions among them to show the strength of the intermedia agenda-setting. Cross-lagged correlations between the different pieces of the media ecosystem by day and by hour are performed. In the 11. Discussion chapter, the results of the case studies are evaluated and compared to previous literature.
In the fourth part the Conclusions, Limitations and Future work are explained.
The Annex contains in chapter 14. Open code and data the list of the code repositories for data gathering and analysis and the database specifications specifications and methodologies for all the datasets. It also includes the transcripts of the semi-structured interviews to newsrooms. Last chapter 15. Extra charts includes data visualizations that did not fit in the dissertation but are complementary and helpful to consult if needed.
There are more data visualizations available at the dissertation webpage at my personal website: numeroteca.org/phd.
1While first level agenda-setting is centered on the transference of salience of the main issues of the agenda, the second level studies the attributes of those issues. The third level analyses the network of interconnected issues and attributes, instead of their intensity of ranking order.
2For decades, before social media and blogs appeared, social movements have sometimes also successfully managed to set or modify the issues in the public agenda and establish their framings.
3To have an account is not a confirmation for social media use or intensity of use, but for the scope of this research is a good proxy for social media use.
4That law was one of the critical causes that fueled the municipal and regional corruption scandals.
5The “MIP question” has been traditionally used by scholars as an indicator to evaluate the public agenda.
6Or indirectly, like the case of the “Correos de Blesa” and the Bankia cscandal, discovered by Partido X but released through eldiario.es news online site. This being an exception.
7The truth of the corruption story is relevant for its newsworthiness and potential to spread to other news outlets.
8Last but not least, I must also mention the personal interest and preoccupation I developed about this topic, which allow me to have more knowledge about the specifics of the Spanish corruption scandals and context.
9There were other scandals that involved more actors or had more political impact, but none as this one since 2018, that received coverage from all the news outlets.
Bilbiography #
Anscombe, F. J. (1973). Graphs in Statistical Analysis. The American Statistician, 27(1), 17–21. https://doi.org/10.1080/00031305.1973.10478966
Benkler, Y. (2008). The Wealth of Networks: How Social Production Transforms Markets and Freedom. In The Wealth of Networks. Yale University Press. https://doi.org/10.12987/9780300127232
Bouza Álvarez, F., Rodríguez, J. J. G., Díaz, R. R., Castromil, A. R., & Chavero, P. (2013). Capítulo 10. Génesis y desarrollo de los encuadres periodísticos en un sistema mediático polarizado: El caso español (2004-2008). Estudios de comunicación política: libro del año 2012, 2013, ISBN 978-84-309-5530-5, págs. 213-238, 213–238. https://dialnet.unirioja.es/servlet/articulo?codigo=7826050
Boyle, T. P. (2001). Intermedia Agenda Setting in the 1996 Presidential Election. Journalism & Mass Communication Quarterly, 78(1), 26–44. https://doi.org/10.1177/107769900107800103
Bruns, A., & Stieglitz, S. (2014). Twitter data: What do they represent? It – Information Technology, 56(5), 240–245. https://doi.org/10.1515/itit-2014-1049
Cardenal, A. S., Aguilar-Paredes, C., Cristancho, C., & Majó-Vázquez, S. (2019). Echo-chambers in online news consumption: Evidence from survey and navigation data in Spain. European Journal of Communication, 34(4), 360–376. https://doi.org/10.1177/0267323119844409
Castromil, A. R. (2013). Negativismo mediático y pluralismo polarizado en la vida política madrileño. In K. Saners, M. J. Canel, A. Capdevila, & M. G. Gurrionero (Eds.), Estudios de comunicación política Libro del año 2012. Tecnos. http://www.tecnos.es/ficha.php?id=3261574
Cohen, B. C. (1963). Press and foreign policy. Princeton University Press.
Costas-Pérez, E., Solé-Ollé, A., & Sorribas-Navarro, P. (2012). Corruption scandals, voter information, and accountability. European Journal of Political Economy, 28(4), 469–484. https://doi.org/10.1016/j.ejpoleco.2012.05.007
Davesa, F., & Palau, A. M. (2013). The Impact of Media Coverage of Corruption on Spanish Public Opinion. Revista Española de Investigaciones Sociológicas, 144. http://reis.cis.es/REIS/PDF/REIS_144_05_ENGLISH1381482849627.pdf
Esser, F., & Hartung, U. (2004). Nazis, Pollution, and no Sex: Political Scandals as a Reflection of Political Culture in Germany. American Behavioral Scientist, 47(8), 1040–1071. https://doi.org/10.1177/0002764203262277
Fernández Durán, R. (2006). El tsunami urbanizador español y mundial: Sobre sus causas y repercusiones devastadoras, y la necesidad de prepararse para el previsible estallido de la burbuja inmobiliaria. In Http://www.nodo50.org/ramonfd/tsunami_urbanizador.pdf. Barcelona : Virus Editorial, 2006. http://libros.metabiblioteca.org/jspui/display-item.jsp
Fundación Ciudadana Civio. (2022). Verba. https://github.com/civio/verba
Graeff, E., Stempeck, M., & Zuckerman, E. (2014). The Battle for ‘Trayvon Martin’: Mapping a Media Controversy Online and Offline. https://dspace.mit.edu/handle/1721.1/123459
Hallin, D. C., & Mancini, P. (2004). Comparing media systems: Three models of media and politics. Cambridge University Press.
Herman, E. S., & Chomsky, N. (1988). Manufacturing consent: The political economy of the mass media (1st ed). Pantheon Books.
Johnston, M. (2005). Syndromes of Corruption: Wealth, Power, and Democracy. Cambridge University Press.
Jowitt, K. (1983). Soviet Neotraditionalism: The political corruption of a Leninist regime. Soviet Studies, 35(3), 275–297. https://doi.org/10.1080/09668138308411481
Kaiser, B. (2019). Targeted: The Cambridge Analytica whistleblower’s inside story of how big data, Trump, and Facebook broke democracy and how it can happen again (First edition.). Harper, an imprint of HarperCollinsPublishers.
Kelly, J. (2008). Pride of Place: Mainstream Media and the Networked Public Sphere. https://ictlogy.net/bibliography/reports/projects.php?idp=1327&lang=es
Lotan, G., Graeff, E., Ananny, M., Gaffney, D., Pearce, I., & Boyd, D. (2011). The Arab Spring| The Revolutions Were Tweeted: Information Flows during the 2011 Tunisian and Egyptian Revolutions. International Journal of Communication, 5(0), Article 0.
Luhmann, Niklas. (2000). The reality of the mass media. Stanford University Press.
Matsa, K. E., Mitchell, A., & Stocking, G. (2017, April 27). Searching for News: The Flint water crisis. Pew Research Center’s Journalism Project. https://www.pewresearch.org/journalism/2017/04/27/searching-for-news-the-flint-water-crisis/
McCombs, M. (2004). Setting the agenda: The mass media and public opinion. Cambridge, UK : Polity ; Malden, MA : Blackwell Pub. http://archive.org/details/settingagendamas0000mcco
McCombs, M., Lopez-Escobar, E., & Llamas, J. P. (2000). Setting the Agenda of Attributes in the 1996 Spanish General Election. Journal of Communication, 50(2), 77–92. https://doi.org/10.1111/j.1460-2466.2000.tb02842.x
McCombs, M., & Shaw, D. L. (1972). The agenda-setting function of mass media. Public Opinion Quarterly, 36(2), 176–187. https://doi.org/10.1086/267990
McCombs, M., & Valenzuela, S. (2021). Setting the agenda: The mass media and public opinion (3rd ed.). Cambridge, UK : Medford, MA: Polity Press, 2020.
Nahon, K., Hemsley, J., Mason, R. M., Walker, S., & Eckert, J. (2013). Information flows in events of political unrest. https://doi.org/10.9776/13259
Q-ÍNDICE. (2006). Voto racional y agenda mediática. Propuesta de seguimiento de la legislatura a través de grupos experimentales, 2005-2008 (Estudio 2764 ). Centro de Investigaciones Sociológicas (CIS). http://analisis.cis.es/cisdb.jsp?ESTUDIO=2764
Rodríguez-Castromil, A., & Chavero, P. (2012). Polarización política y negativismo mediático. Similitudes y diferencias en la prensa de derecha y la de izquierda en las elecciones autonómicas y municipales de 2011 [Info:eu-repo/semantics/article]. UIMA-Universidad a Coruña. https://eprints.ucm.es/id/eprint/43609/
Strate, L. (2004). A Media Ecology Review. Communication Research Trends, 23(2), 1–48.
Tufte, E. R. (2001). The visual display of quantitative information (2nd ed.). Graphic Press.
Villoria, M., & Jiménez, F. (2012). La corrupción en España (2004-2010): Datos, percepción y efectos / Corruption in Spain (2004-2010): Data, Perception and Consequences. Reis, 138, 109–134.
Watt, J. H., Mazza, M., & Snyder, L. (1993). Agenda-Setting Effects of Television News Coverage and the Effects Decay Curve. Communication Research, 20(3), 408–435. https://doi.org/10.1177/009365093020003004
Wedel, J. R. (2001). Corruption and organized crime in post-communist states: New ways of manifesting old patterns. 7(1), 3–61.
Yeuell, G. H. (1928). The Negro Press as a Factor in Education. The Journal of Educational Sociology, 2(2), 92–98. https://doi.org/10.2307/2961865