- 6.1 Corruption in the courts
- 6.2 Public perception of corruption in Spain
- 6.3 Analyzing more than 100 years of newspapers
Each method to quantify corruption faces different drawbacks since corruption, as a criminal and clandestine activity, does not cause direct victims most of the time, which usually leads to fewer cases being discovered than there are. Also, denouncements can sometimes be part of partisan politics (Villoria & Jiménez, 2012). Data obtained from the courts can measure the quality or transparency of the judicial system, the political will to combat corruption, or the actual levels of corruption (Boehm & Lambsdorff, 2009; Treisman, 2007; Villoria & Jiménez, 2012). However, these are indirect corruption measurements: there is no real-world data to compare them1. That is why, in the present research, the available indirect measures are explored to quantify corruption in the Spanish context.
The rich literature on the subject of political corruption shows the diverse strategies employed to quantify it and the way it is perceived by society. Based on a classification by Solimano (2008), Villoria and Jiménez (2012) (p.16) grouped these methodologies into three categories: (a) corruption in the courts, “based on corruption complaints and investigations opened by the Public Prosecutor’s Office or investigating judges”; (b) corruption perception, “through corruption perception surveys of domestic and foreign investors, experts or citizens in general”; and (c) opinion on direct experience with corruption, “through surveys in which citizens are asked about their direct experiences in the payment of bribes or extortion they suffer from state officials”.
Following this classification, I review the different ways to measure corruption indirectly in the Spanish context in the following sections. First, section 6.1 explores the available data published by the judiciary system, corruption in the courts. Second, section 6.2 analyzes various methods to quantify corruption perception based on public opinion polls. The third category, related to direct experience with corruption, is not analyzed, given the low levels in Spain. As Villoria and Jiménez (2012) warn, administrative corruption can potentially be perceived directly, but political corruption can not: It is through news media that information about political corruption can arrive to the public sphere. This chapter draws from the book I co-wrote about corruption in Spain (Sánchez Sánchez & Rey-Mazón, 2019).
Finally, in section 6.3, a longitudinal study of 136 years of corruption coverage in two Spanish newspapers is conducted as a preliminary approach to the rest of the mass media ecosystem analyses developed in the longitudinal and in-depth studies2 (chapters 8, 9 and 10).
6.1 Corruption in the courts #
The number of corruption-related trials seems a good indicator of the number of corrupt activities and of the way the judicial system works, but it has the problem that not all corruption scandals arrive to the courts. In some cases, the statute of limitations had expired before it arrived in the courts. In others, it did not gather enough evidence to be prosecuted.
The ideal way to obtain reliable data series on the number of judicial cases or investigations on corruption is to turn to the Superior Council of the Judiciary (CGPJ) and the Attorney General’s Office. However, the CGPJ does not publish information in ways that allow its analysis. It started to publish statistical information on 2015, but its database of sentences and orders does not allow the massive download of documents to perform analysis based on search queries.
From a legal perspective, corruption is not a type of crime but a group of criminal activities that can be categorized as such. The following list of criminal types classifies corruption-related crimes according to the General Council of the Judiciary and the Courts and Tribunals (Consejo General del Poder Judicial, CGPJ) (del Poder Judicial, 2016) and justifies the existence, inside it, of a Support Unit for Corruption Cases (Unidad de Apoyo a las Causas por Corrupción):
| Price alteration in public tenders and auctions. Money laundering. Bribery. Corruption between individuals. Fraud. Crimes against the Public Treasury and Social Security. Corruption offenses in international economic transactions. Prevarication crimes. Crimes related to industrial intellectual property and to the market and consumers. Corporate crimes. Fraud and illegal exactions. Infidelity in the custody of documents and violation of secrets. Punishable insolvencies. Negotiations and activities prohibited to public officials and abuses in the exercise of their functions. Embezzlement of public funds. Omission of the duty to prosecute crimes. Influence peddling. | Alteración de precios en concursos y subastas públicas. Blanqueo de capitales. Cohecho. Corrupción entre particulares. Defraudaciones. Delitos contra la Hacienda Pública y contra la Seguridad Social. Delitos de corrupción en las transacciones económicas internacionales. Delitos de prevaricación. Delitos relativos a la propiedad intelectual industrial y al mercado y los consumidores. Delitos societarios. Fraudes y exacciones ilegales. Infidelidad en la custodia de documentos y violación de secretos. Insolvencias punibles. Negociaciones y actividades prohibidas a los funcionarios públicos y de los abusos en el ejercicio de su función. Malversación de caudales públicos. Omisión del deber de perseguir delitos. Tráfico de influencias. |
The Attorney General’s Office does publish statistical information annually since 18833. A statistical table is published almost every year and contains the cases or proceedings that have been processed, classified by type of crime, and by Provincial or Regional/County Courtt. However, yearly datasets cannot be used to analyze the historical evolution because data are not published in reusable formats, and the quality of the scanned documents is not good enough to read the information in the tables. Besides, the classification of crimes is not maintained over time or is directly not available during different periods.
The Special Attorney General’s Office against Corruption and Organized Crime, also called the Anti-Corruption Prosecutor’s Office (ACPO)4, created in 1995, publishes annual reports with the number of accusations and cases related to corruption but does it in a non-systematic way. Besides the lack of a structured format of publication, the growth of corruption-related activities in the most recent years based on these data series cannot be differentiated from that of the ACPO’s staff (formed by prosecutors, delegated and temporary, as well as collaborating personnel and support units). The increase in staff seems to answer the prosecutors’ continuous request to provide ACPO with the resources it needs5.
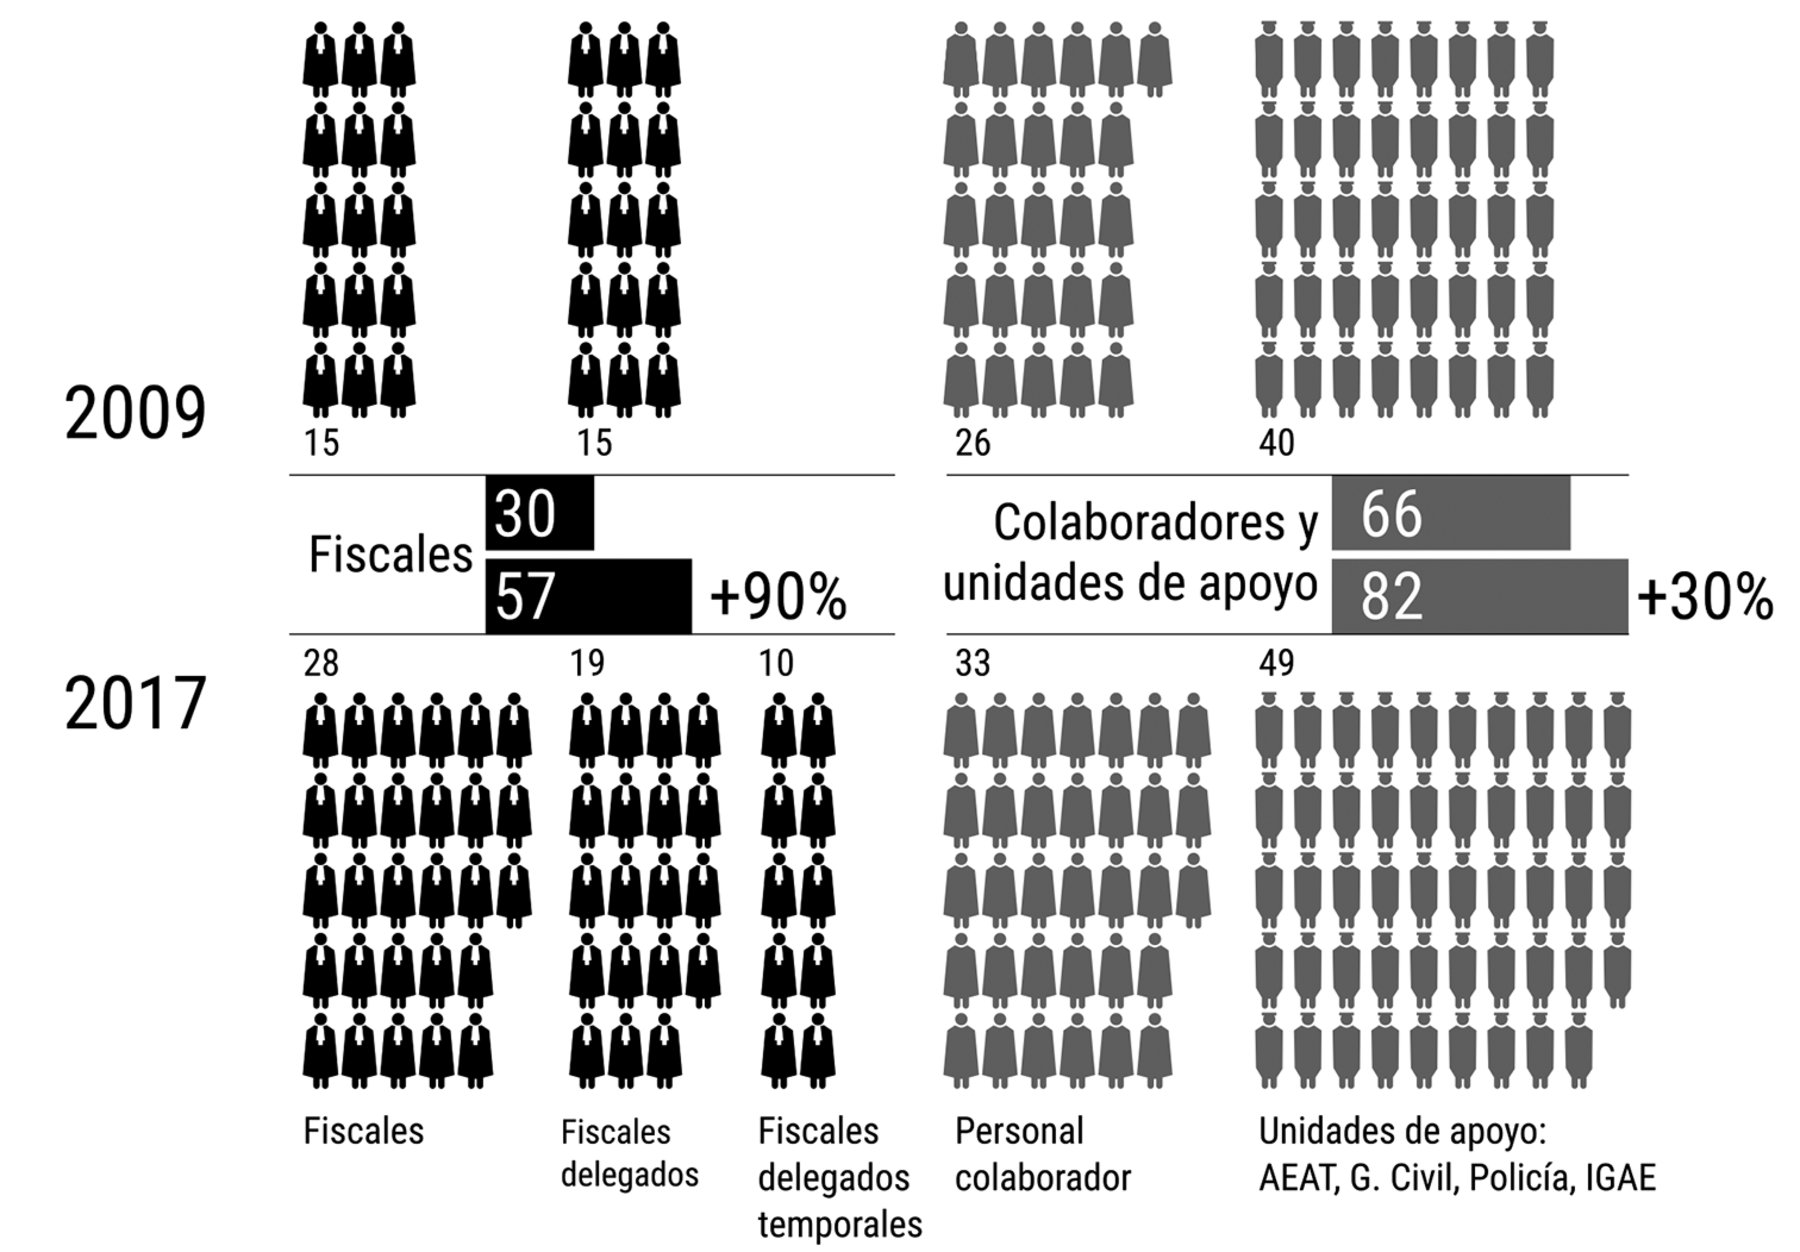
For the 2009-2017 period, the number of prosecutors (fiscales) increased by 90% –from 30 to 57– and of collaborators by 30% –from 66 to 82–(Fig. 92). The year to year analysis shows that the growth in the number of pleadings, proceedings and sentences has been greater than the increase in the number of staff. The load of activity/work for each prosecutor has grown (Fig. 93 and 94).
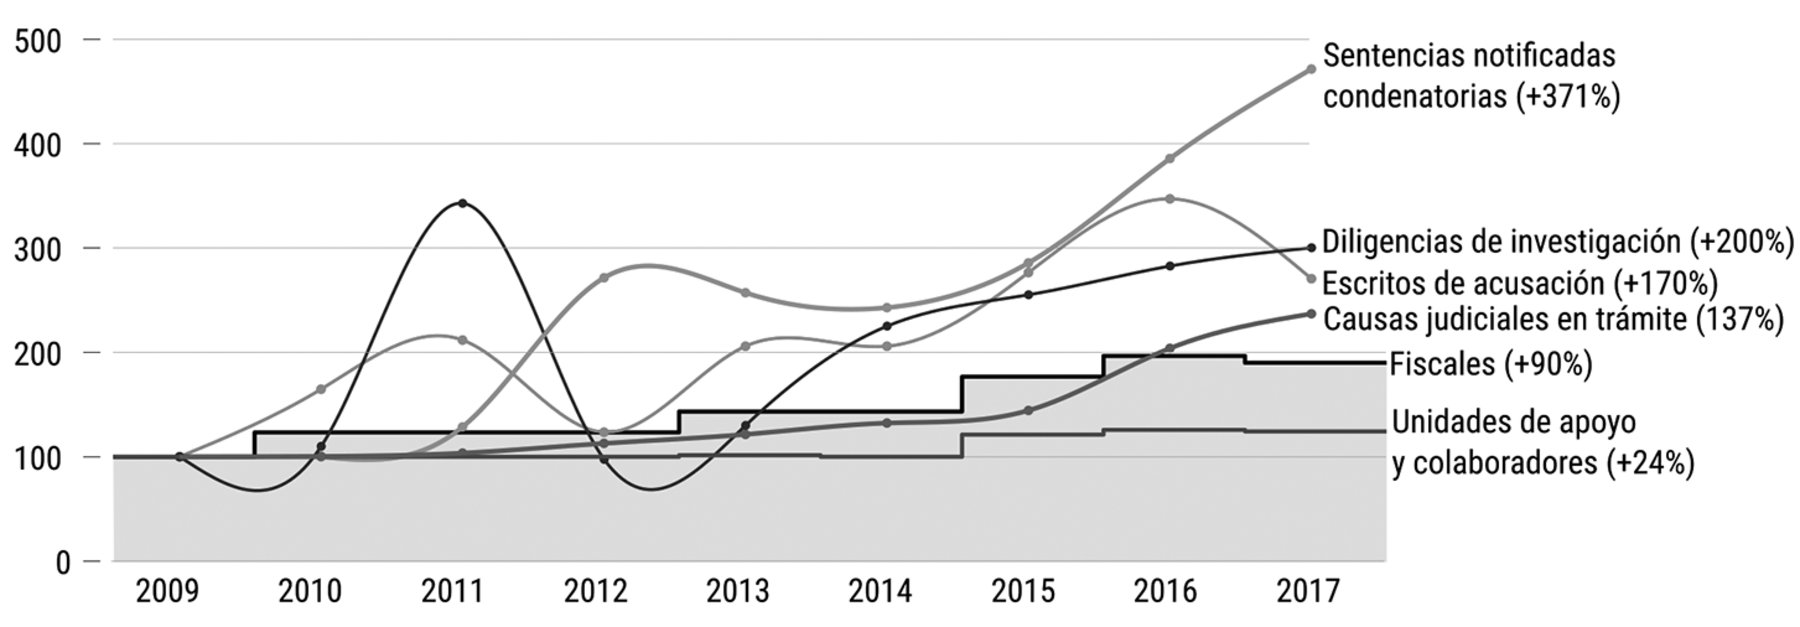
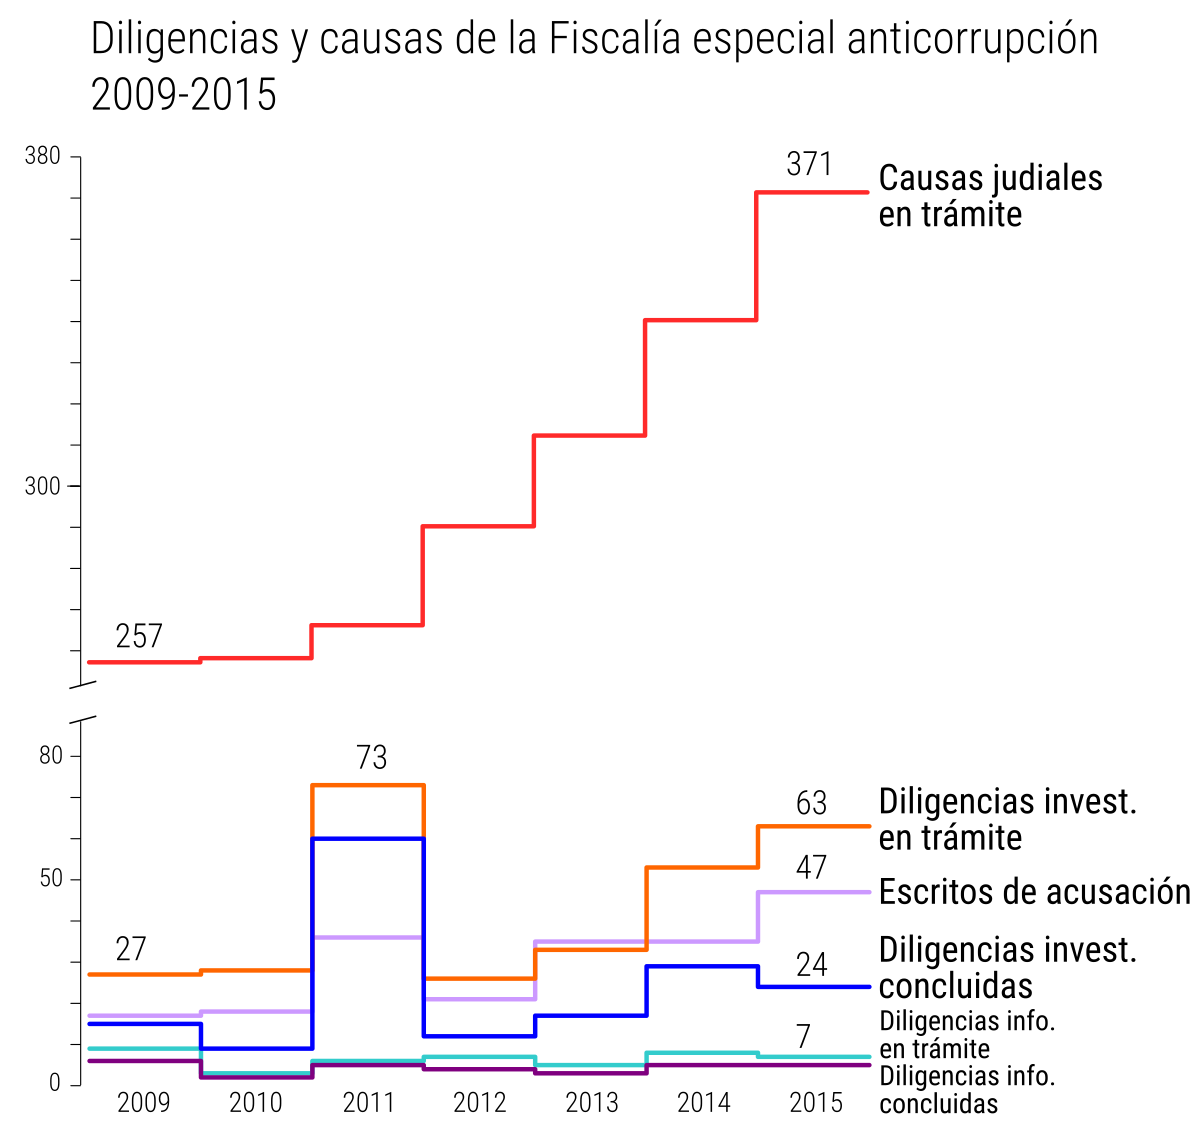
In this period, “indictments increased by 170 percent (from 17 to 46) and investigative proceedings by around 200 percent on average, both those in process and pending and those concluded. Sentences with conviction increased from 7 in 2010 to 33 in 2017 (a growth of 371 percent), which is a considerable growth and well above that of the other variables studied. This may be due to the dismemberment since 2016 of some criminal proceedings into separate pieces to simplify their processing. It may also explain why the court cases pending in which the Anti-Corruption Prosecutor’s Office (ACPO) intervened rose from 257 in 2009 to 371 in 2015 (+44%), a proportionally smaller increase than the growth in the number of prosecutors’ staff and before the dismemberment of the cases, to 524 in 2016 (+104%) or 609 (+137%)” (Sánchez & Rey-Mazón, 2018, p. 337). This growth in the cases handled, or rather accumulated by the ACPO, can be explained by the lack of resources to process the cases in due time and must not be interpreted as an increasing corruption but of the number of discovered cases. It is also partially related to the fact that the time when a case is opened differs considerably from when it happened.
These data are obtained with great effort, painstakingly extracted from each of the yearly summaries, but it is not easy to extract more precise information from them. This would require better and more disaggregated data to draw other conclusions than the number of cases.
Other datasets about open investigations or the number of detainees from the Ministry of the Interior, from the investigations of the Economic and Fiscal Crime Unit (UDEF) of the National Police Corps and the Central Operative Unit (UCO) of the Civil Guard (Guardia Civil), are not published systematically. The number of persons convicted annually by firm sentence, according to the type of crime, and the sex, age or nationality of the convicted, are made available by the INE on an annual and standardized basis since 20136. The problem with these data to track corruption is that due to the long prosecution processes, there is no connection between when the sentence arrives and when the corrupt activity occurred, or the scandal appeared in the news.
6.2 Public perception of corruption in Spain #
Opinion surveys use two metrics related to corruption:perception and direct experience. In the case of Spain, there are strong divergences between the two (Villoria & Jiménez, 2012): for the direct experience of corruption, including data about the request for a bribe, the values according to the Global Corruption Barometer of Transparency International (TI) for the 2004-2010 period7 are below 5%, i.e., very low, which contrasts with the values above 40% for the perceived corruption as one of the Most Important Problems (MIP) in 2013 (CIS barometers). The perceived corruption is very different from the experienced: “the most important corruption in economic terms, which generates the most scandal and causes the greatest perception of the problem, is the corruption that occurs at the political level of governments (grand corruption) and not corruption at the administrative levels (petty corruption)” (Ibid. p. 117-118).
Different datasets measure public opinion periodically. They can be used to evaluate the evolution of corruption as a MIP in Spain. At the European level, Eurobarometers8 is the polling instrument used by the European Commission, the European Parliament, and other EU institutions. At the country level, the CIS barometers9 is carried out by the Centro de Investigaciones Sociológicas. There also exist regional polls like the one organized by the Centre d’Estudis d’Opinió10 in Catalonia.
Eurobarometers are conducted every two years and offer the possibility to compare data across countries:
| How widespread is corruption in … | 2005 | 2007 | 2009 | 2011 | 2013 | 2017 | 2020 |
| Spain | 73% | 83 | 88 | 88 | 95 | 94 | 94 |
| Portugal | 91 | 95 | 97 | 97 | 90 | 92 | 94 |
| EU 27 | 72 | 75 | 78 | 74 | 76 | 68 | 71 |
The CIS barometers aim to measure the state of public opinion based on interviews in which respondents must answer a series of fixed questions. The survey started in 1979 and has been conducted every month (except in August) since the end of 2000. One of the questions tries to capture the public agenda by asking, “Which is, in your opinion, the main problem currently existing in Spain? And the second? And the third?” (CIS Barometer, December 2011). This question can be inscribed in the long tradition in the agenda-setting literature that uses the Gallup MIP series (Most Important Problem), a similar periodical survey in the USA that asks a similar question (McCombs & Zhu, 1995; Smith, 1980) as explained in section 2.3 Measuring public opinion.
The main difference between the CIS barometers with the question in the Gallup polls is that it asks for the three most important problems, not just one, which provides a more nuanced and not so restrictive view of the public agenda since other issues, different from the most important ones, can emerge. Surveyors annotate the open-ended answers for the first, second, and third problems and then re-code the answers in pre-established categories11. “Corruption and fraud” as a defined category was added to the list to classify open-ended answers in 1988, obtaining that year 2.5 percent of the answers. In January 1995, with corruption scandals of the then governing socialists on the rise, the percentage of corruption as MIP reached 33.5%, the highest to that date, second only to unemployment (84.9%). After that peak, and with the victory of the People’s Party in the general elections in March 1996, corruption as a perceived problem decreased and was almost forgotten for many years. Some of the corruption schemes that came to light in the 2000s started during the 1990s (e.g. Gürtel scandal), while unemployment, terrorism, and immigration remained continuously at the top of the list of perceived problems (Fig. 95).
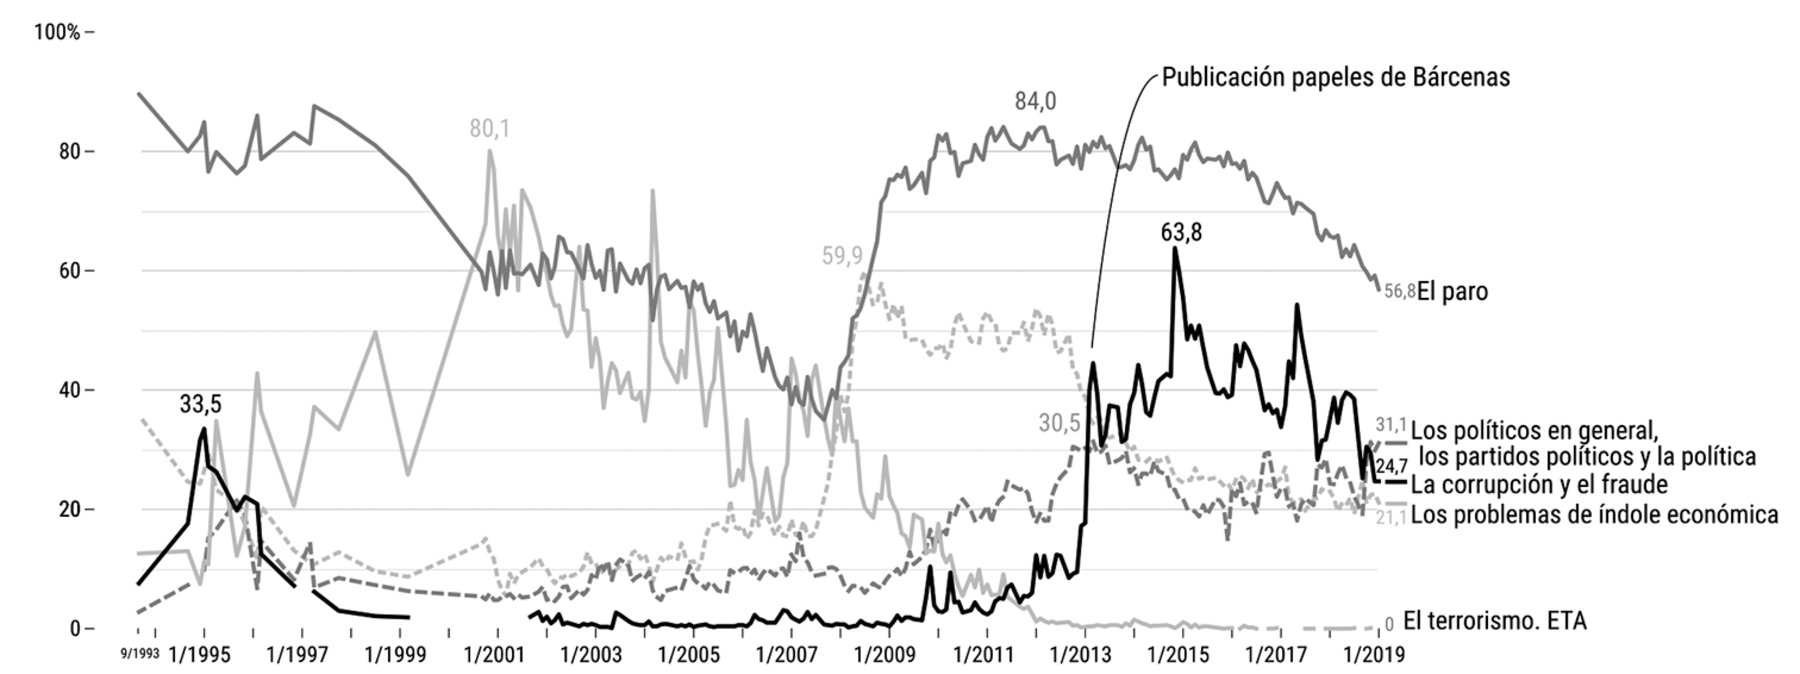
In 2009, as it is later studied in detail, corruption started to climb positions, and by the end of 2012, it reached fourth place, appearing in 17.2% of the answers. In February 2013, just after the publication of “the Bárcenas papers” (the scandal of the Popular Party’s “B accounting” related to the Gürtel case), corruption and fraud skyrocketed from 17.5 in the previous month to 40%, ahead of economic problems (35.4) and “politicians in general, political parties and politics” (29.7). Almost 20 years later after its first peak, corruption returned to second place and has never left at the top of the perceived problems, never falling below 20%. In the November 2014 poll, it rose more than twenty points in a single month, reaching 63.8%, its historical maximum, probably due to the Púnica scandal, a scandal of municipal and regional corruption in Madrid uncovered the previous month that involved the president of the region (Ignacio González). Its lowest point in this period was reached in December 2017, when the political crisis caused by the independence declaration in Catalonia “stole” its second place, and at the end of 2018, when the perception of politicians in general as a problem surpassed it.
As is later explored in detail, we believe that the discovery and publication of many corruption scandals by the news media involving the two main national parties, PP and PSOE, as well as CiU in Catalonia, is the main cause for the increase in the perception of corruption as one of the MIP in the 2010s to historic heights. The causes of this rise are multiple: on the one hand, the difficult economic situation in large social sectors after the financial and real estate crisis; this led to a change in the political climate after the mobilizations of the 15M-indignados movement in 2011 that showed the increased indignation among citizens; simultaneously, mainstream media became more sensitive to these issues and aligned themselves with what they perceived to be the public’s interest; finally, the internal war within the political parties also laid the ground for the emergence of corruption scandals (Sánchez Sánchez & Rey-Mazón, 2019).
One thing that must be considered is that public opinion data are strongly auto-correlated. Knowing the last opinion survey percentage of respondents to the MIP question, it is likely that the values of subsequent surveys will be very similar. In a Pearson autocorrelation from one survey to the next, looking into various issues, the values are +0.97 for corruption, +0.93 for ETA-terrorism, +0.97 for unemployment, +0.97 for housing, +0.97 for the economy, +0.94 for immigration and +0.78 for education12. It is possible to infer from these observations that people’s opinions do not change very quickly from month to month, except on certain occasions related to a crisis or specific events. The questions that remain to be answered are how likely is this to happen and whether a shift in news media attention drives the changes (when they take place).
Section 7.5.3 > A. Public opinion surveys: CIS Barometer reviews the CIS barometer database in detail.
6.3 Analyzing more than 100 years of newspapers #
News media coverage is used intensively in the longitudinal case studies (chapters 9 and 10) of the present research. The following approach to news coverage related to corruption is a preliminary exploration of the limits of word search query-based content analysis in a 136 years long longitudinal study.
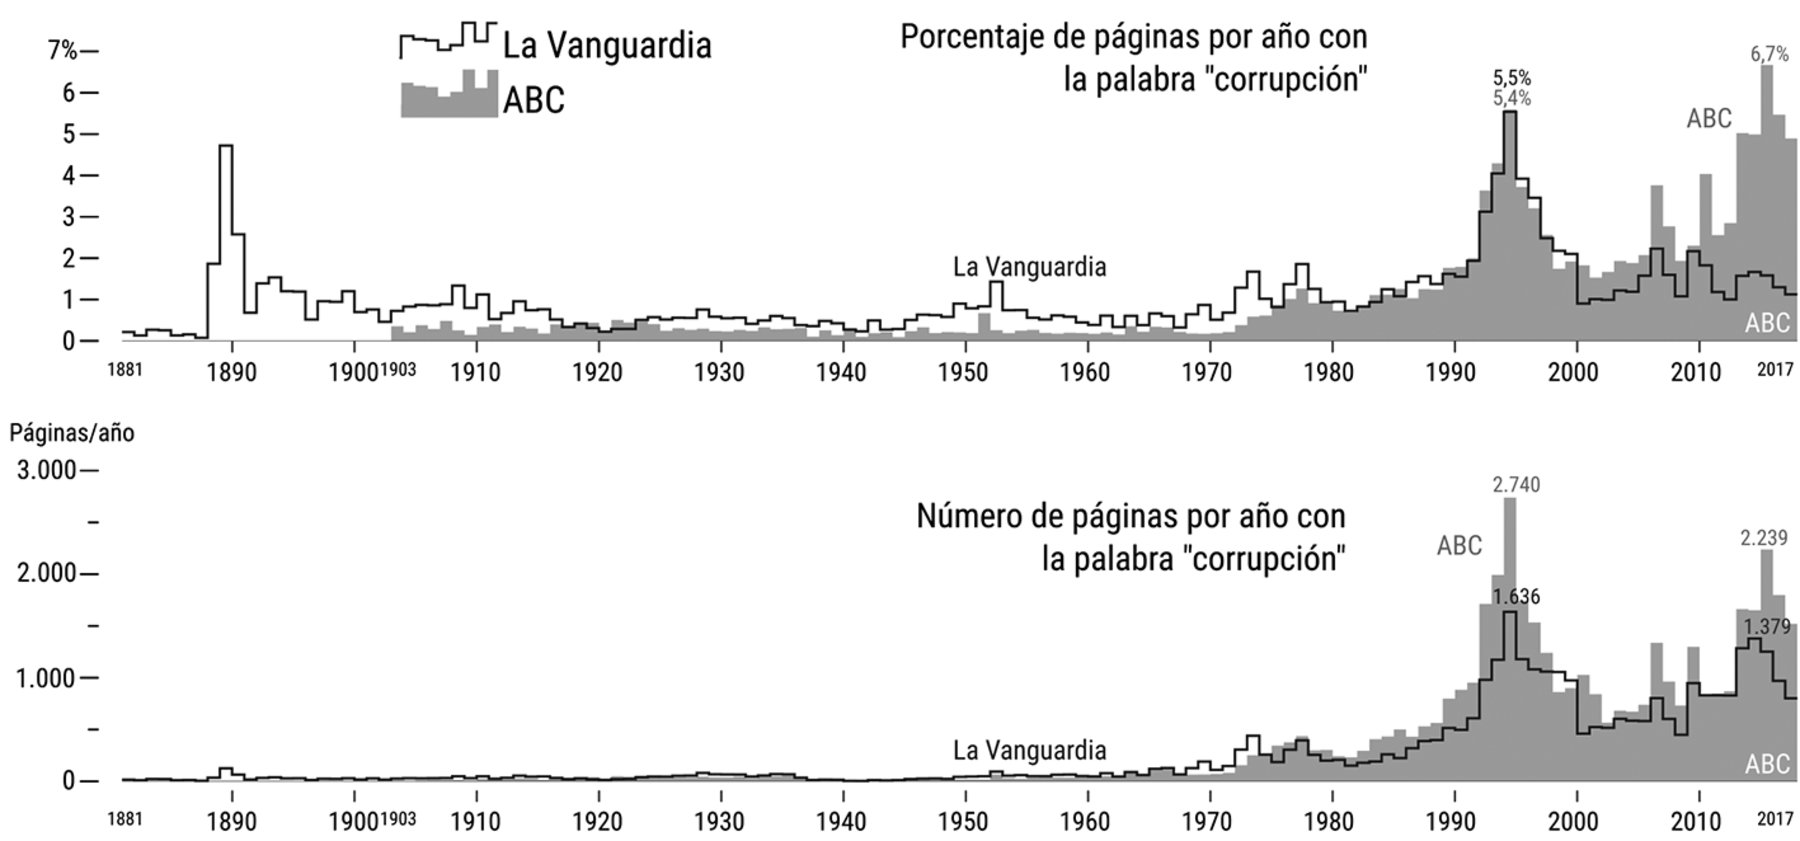
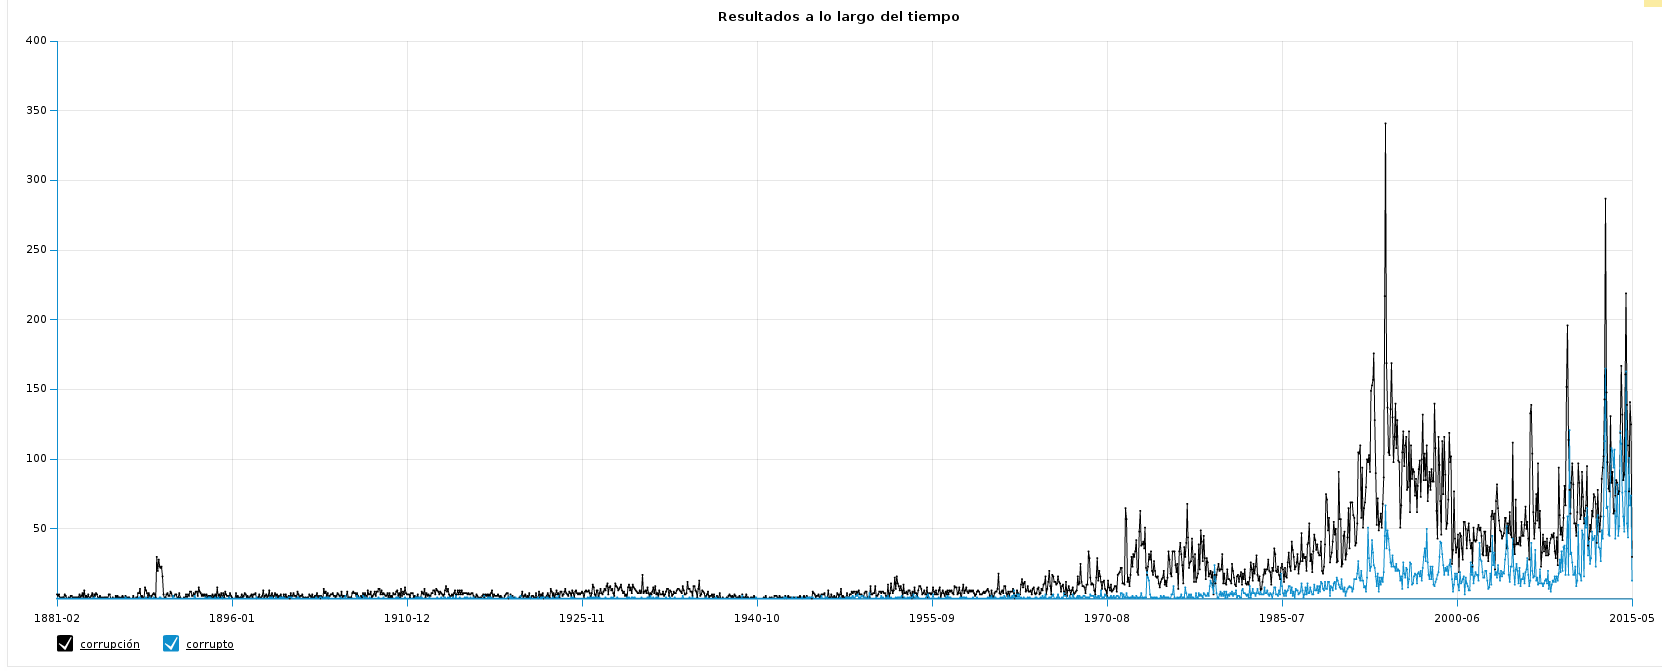
For the book C de España. Manual para entender al corrupción (Sánchez Sánchez & Rey-Mazón, 2019) we analyzed 136 years of appearances of the word “corruption” in ABC, and La Vanguardia (1881-2017), the oldest active newspapers in Spain; both of them have available online newspaper archives13. We used a simple approach, consisting in counting the appearance of certain words related to corruption (corrupción, corrupto, enchufismo, corruptela…) in the pages of both newspapers since their foundation (La Vanguardia was founded in 1881 and ABC in 1903)14. The analysis is helpful to see the approximate evolution of corruption coverage and easily identifies the two most important peaks in the coverage—1994 and 2014-201515 (Fig. 5). The high values in the case of La Vanguardia around 1890 are due to false positives. Comparatively, the rest of the 20th century seems relatively flat, with no change during the democratic years of the Second Republic (1931-1936). In the 1970s, before Franco died in 1974, and then with the arrival of democracy at the end of this decade, the coverage of corruption increased significantly in both newspapers, especially after the socialists arrived at the government in 1982. Corruption reached its first significant peak in 1994 with the corruption scandals linked to the socialist government at the end of their mandate, including the scandal of reserved funds and the GAL (see 4.2 Short history of corruption in Spain). Both newspapers experienced a drop in the exposure of corruption cases during the economic boom of the real estate bubble and rose again at the end of the 2010s. The rise in the news about corruption is more visible in ABC than in La Vanguardia, but a more detailed analysis would be needed to explain the origin of these considerable differences. The web interface of the online archive in La Vanguardia offers less options, like the detailed line chart of Fig. 97.
Canel & Sanders (2005) provide some light on the bias that could be introduced with this simplistic approach of using word-related search queries. They analyzed the words used to cover corruption scandals in UK and Spain in the 1990s; for Spanish news items, they employed the words “crisis” and “case” (caso). They found that in Spain, from all analyzed stories (including news, reports, jokes, interviews, and editorials) that featured corruption scandals on the day after the incident, “while the term corruption is mentioned in only 5.3% of the news items, it is mentioned in 19.1% of the opinion articles” (p. 170). This means that using corruption-related words like “corruption” underestimates the total number of articles dedicated to corruption since only 1 in 20 news stories (i.e. 5%) include that word. Furthermore, this method is also subject to false count positives since the words used for the analysis can also be related to other meanings (related to religion or corruption of underage), i.e., not directly to political corruption.
Despite all the limitations for measuring the presence of corruption in the news media –word search limitation, only using two newspapers, false positives, yearly data granularity– this method makes it possible to see a certain relationship between this limited proxy of corruption coverage and public opinion. For example, the peak of new coverage in 1993-1995 reflects the opinion chart that captures the percentage of answers that include “corruption” as one of the 3 MIP. The rise of coverage from 2009 to 2016 in ABC can be related to the general trend of corruption as a MIP, although the relation seems to be less clear, especially in La Vanguardia (Fig. 98).
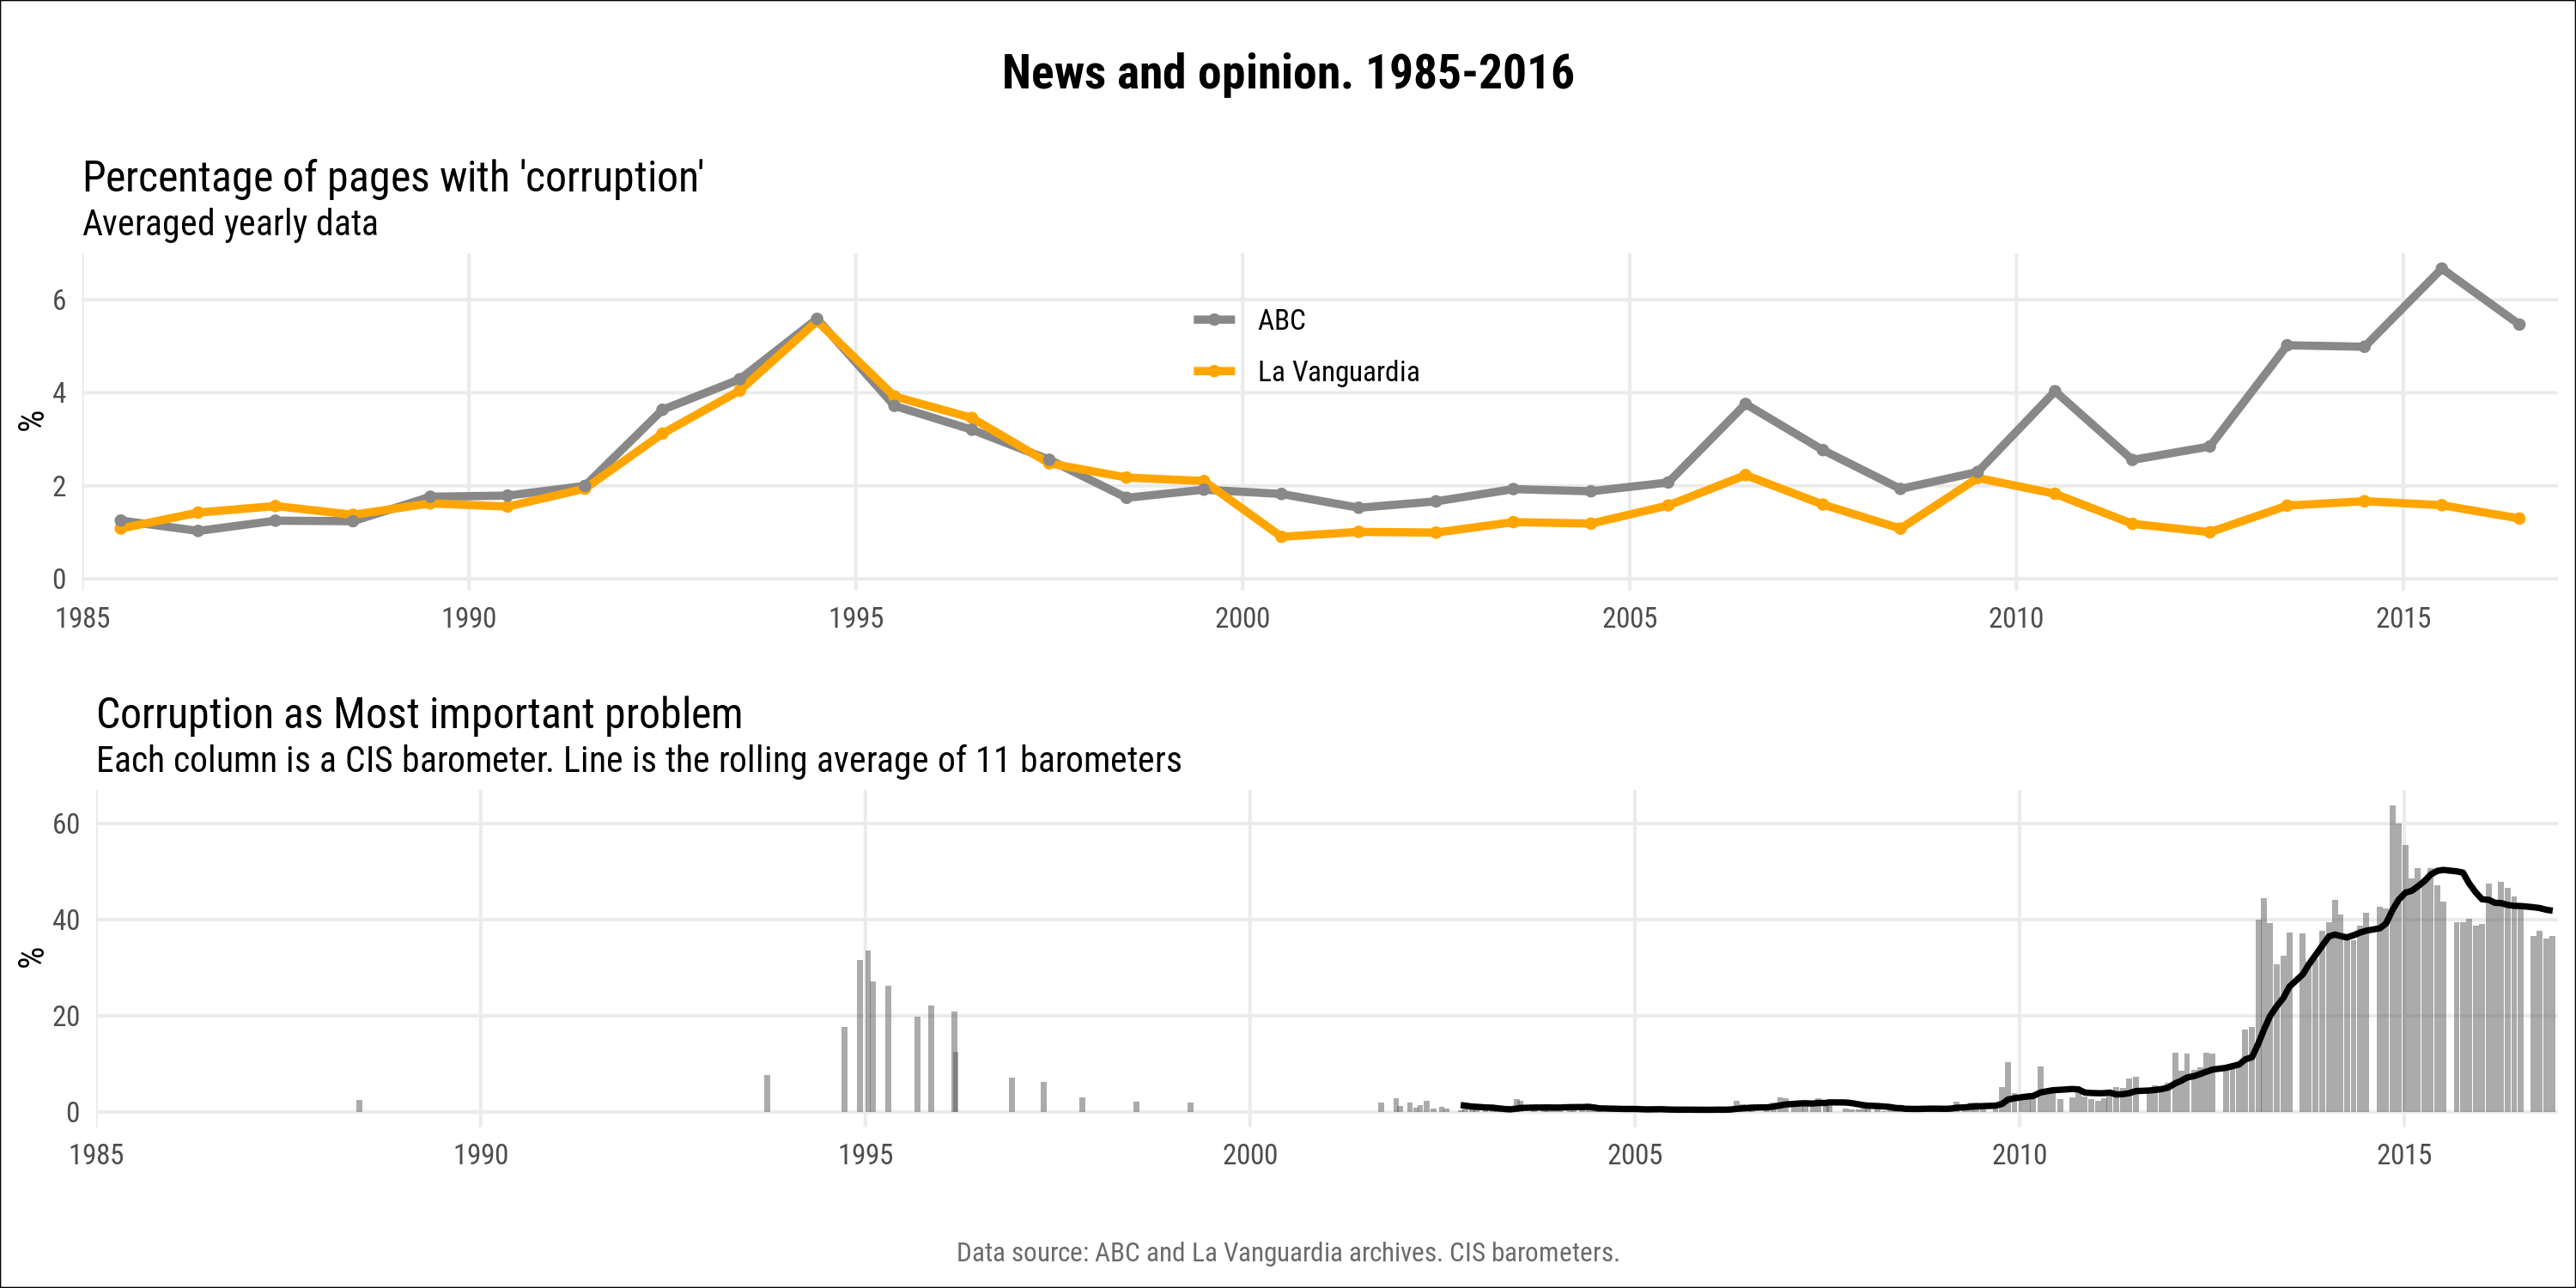
This difference can be explained –besides the reasons already mentioned– by the fact that this measure does not account for the salience of the stories. The appearance of a word on whichever page of the newspaper would have the same value and impact as if it appeared on page one (something that is not to be expected from a communication, journalistic or cognitive perspective).
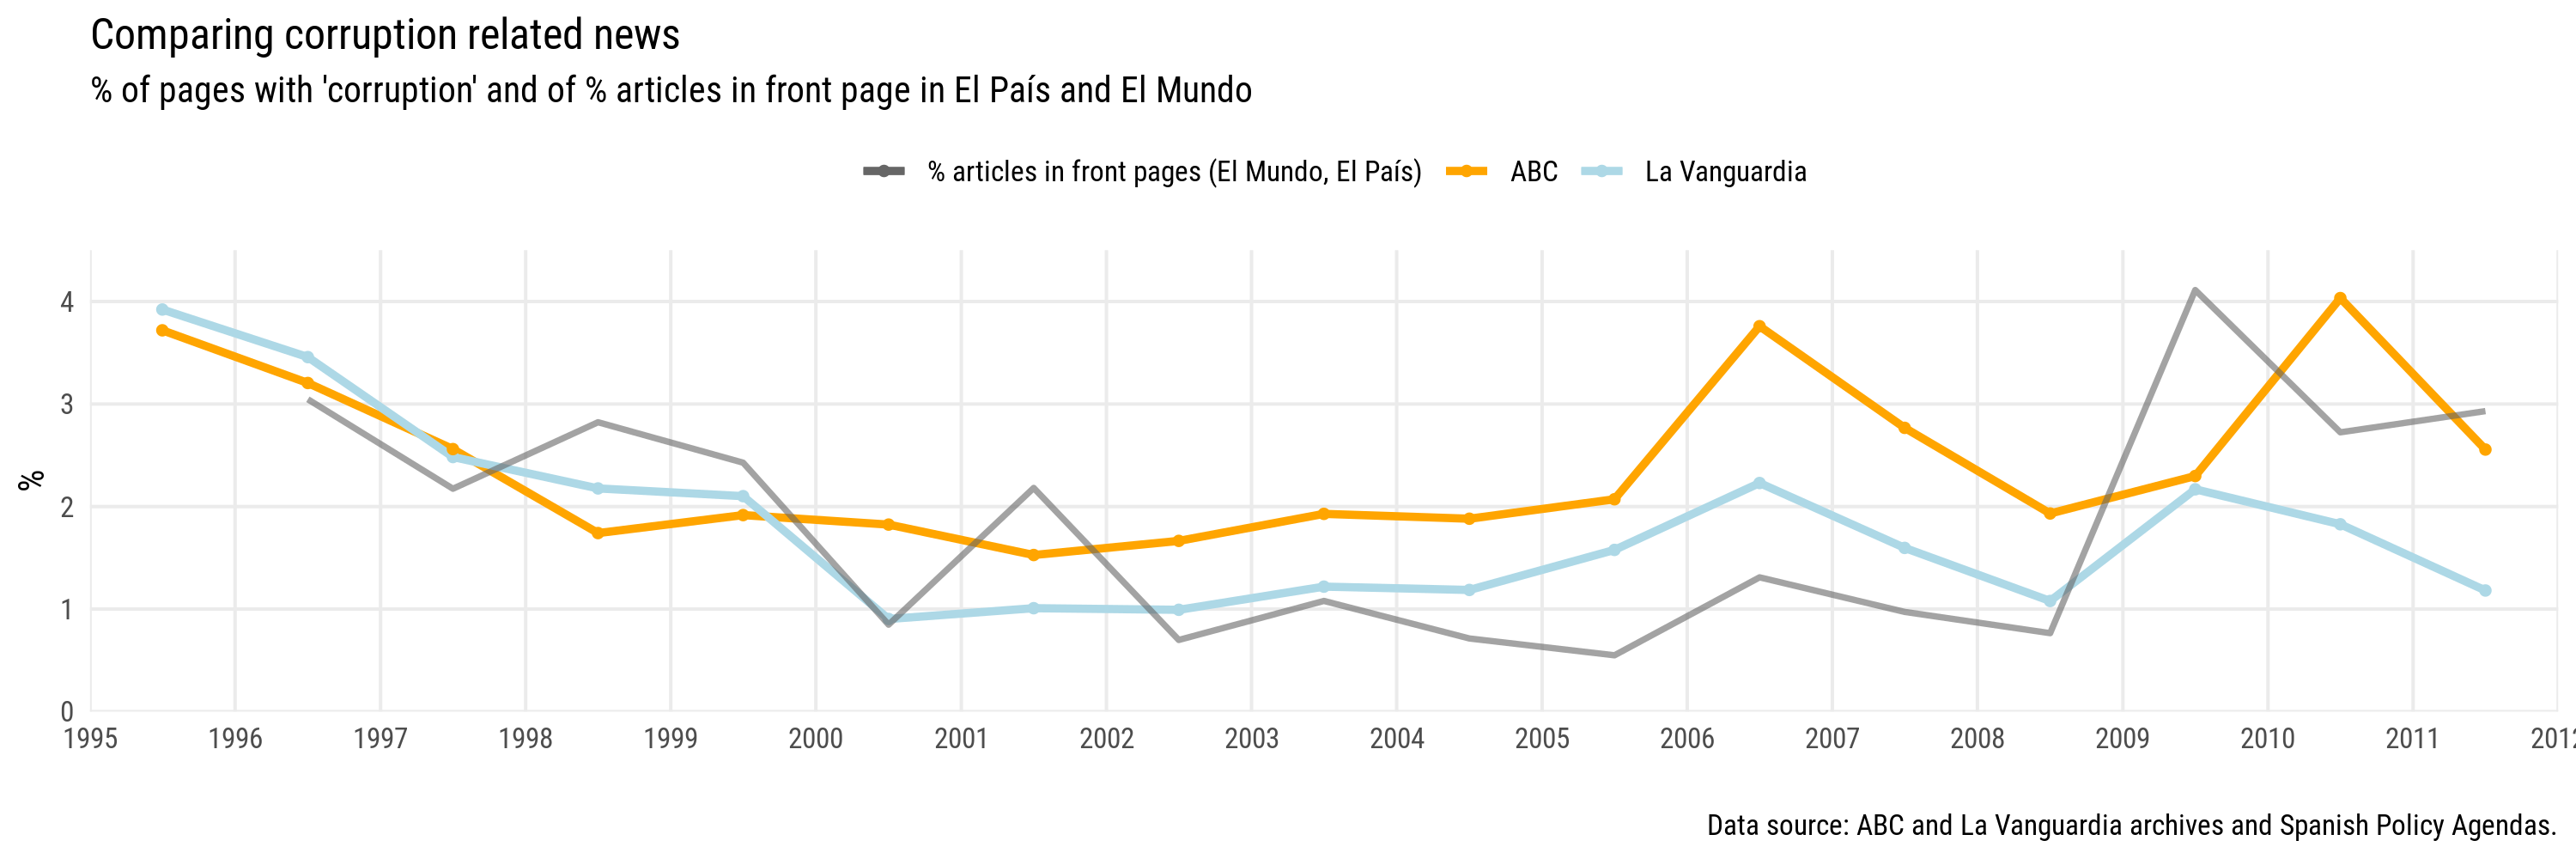
Suppose these news data series are compared to other datasets that use more precise methodologies. That is the case of the Spanish Policy Agendas (SPA) dataset (Chaqués-Bonafont et al., 2014, 2015), presented later in section 7.5, which measures corruption coverage by analyzing the content of every article on the front page manually. In that case, they seem to follow roughly the same shape, declining steadily since 1996, keeping relative low values during 2000-2005, and starts rising strongly in 2009 (Fig. 8). The more nuanced method that the SPA dataset uses allows for lower and higher values as it is more sensitive to the differences of salience in coverage.
Historical newspaper archives are great resources for conducting this type of analysis and can offer precious insights into the selection and framing of news in longitudinal studies. However, extracting information from these archives is currently very time-consuming. It involves manually searching and annotating the yearly data for each of the queries. Additionally, online newspaper archives have discontinued many of their features –both archives of ABC and La Vanguardia now offer fewer possibilities to extract quantitative information than when this analysis was originally made in 2017–, making it very difficult to use this method. Today it would be almost impossible to replicate this analysis.
Summary
This chapter has reviewed different existing strategies in the literature to quantify corruption: in the courts and public perception. The exploration showed the significant limitations of the official data published by the Spanish judiciary system, Ministry of the Interior, and different police-related institution data, which are not published or structured in ways that allow a systematic download, processing, and analysis. These findings prompted us to focus on public opinion data, available in CIS barometers, and mass media coverage data based on pre-existing and self-built databases for various media channels that will be presented in the following chapter.
The last section, is a preliminary case study that exposes the great potential of using historical newspaper archives for longitudinal studies, and, at the same time, the limitations related to word search query for content analysis and the fragility of the data environment that makes it difficult, or impossible, to access and download the disaggregated datasets.
1Other agenda setting studies use, for example, unemployment rates data, to contrast the salience of the issue of unemployment in the press to these real-world data series, like in Erbring et al. (1980).
2As explained earlier (see 3. Corruption and corruption scandals), Costas-Pérez et al. (2012) found that extensive media coverage of scandals had an important effect on vote loss in municipal elections and the impact of regional and national news coverage had a greater impact than local coverage.
3Upon request, the Prosecutor General’s Office sends a DVD with all its annual reports free of charge
4GRECO translation for this office is “Special Attorney General’s Office for the Repression of Economic Offences related with Corruption”.
5“As they comment in their 2017 report, the situation “evidences the shortage of the staff of the Prosecutor’s Office and the need to proceed to increase the number of workers”. The staff’s increase and the activities it performs is therefore the consequence of two things, the growing number of cases that that the Special Prosecutor’s Office seems cannot cope with due to lack of resources and to the political will to increase the capacity for action of this Special Prosecutor’s Office”. Sánchez & Rey-Mazón (2018) p. 336-337
6http://www.ine.es/dynt3/inebase/index.htm?padre=3978
7“The percentage of people who acknowledged having paid a bribe in the last year in Spain, data from 2004 to 2010, is very low, below five percent, especially if we compare it with the average of countries in Latin America (23) or sub-Saharan Africa (56)”
8https://europa.eu/eurobarometer
9https://www.cis.es/cis/opencm/EN/11_barometros/index.jsp
10https://ceo.gencat.cat/ca/inici
11This has not been always the case and, for example in the May 1992 survey, respondent had to select three issues from a list of 10 issues
12This lower value might be related to education not being among the most important issues and with reduced scoring in public opinion issues rankings has more variability.
13The current ABC newspaper online archive (https://www.abc.es/archivo/buscador/) no longer offers the number of results per year as the previous version did (https://hemeroteca.abc.es). La Vanguardia newspaper online archive is available at https://www.lavanguardia.com/hemeroteca.
14La Vanguardia is a right-wing, Catalan nationalist, liberal newspaper based and focused on Catalonia, while ABC is a right-wing, monarchist and Catholic newspaper with a state-wide scope published from Madrid
15The percentage of pages is calculated against the total of published pages per year. As the total amount of pages is not known, it has been calculated with the number of pages that contain the word “de”, one of the most common in the Spanish language, as a proxy.
Bibliography of this chapter #
Boehm, F., & Lambsdorff, J. G. (2009). Corrupción y anticorrupción: Una perspectiva neo institucional. Revista de Economía Institucional, 11(21), 45–72.
Canel, M. J., & Sanders, K. (2005). El poder de los medios en los escándalos políticos: La fuerza simbólica de la noticia icono. Anàlisi : quaderns de comunicació i cultura, 32, 163–178.
Chaqués-Bonafont, L., Palau, A. M., & Baumgartner, F. R. (2015). Agenda Dynamics in Spain. London, Palgrave.
Chaqués-Bonafont, L., Palau, A. M., & Marquez, L. M. M. (2014). Policy Promises and Governmental Activities in Spain. In C. Green-Pedersen & S. Walgrave (Eds.), Agenda Setting, Policies, and Political Systems. A Comparative Approach (pp. 183–200). University of Chicago Press. https://doi.org/10.7208/9780226128443-012
del Poder Judicial, E. C. G. (2016). Memoria sobre el estado, funcionamiento y actividades del Consejo General del Poder Judicial y de los Juzgados y Tribunales en el año 2015.
Erbring, L., Goldenberg, E. N., & Miller, A. H. (1980). Front-Page News and Real-World Cues: A New Look at Agenda-Setting by the Media. American Journal of Political Science, 24(1), 16–49. https://doi.org/10.2307/2110923
Sánchez Sánchez, I., & Rey-Mazón, P. (2019). C de España: Manual para entender la corrupción. Almud Ediciones de Castilla-La Mancha.
Solimano, A. (2008). La corrupción: Motivaciones individuales, fallas del Estado y desarrollo. In A. Solimano, V. Tanzi, & F. Del Solar, Las termitas del Estado. Ensayos sobre corrupción, transparencia y desarrollo. Fondo de Cultura Económica-CIGLOB.
Treisman, D. (2007). What Have We Learned About the Causes of Corruption from Ten Years of Cross-National Empirical Research? Annual Review of Political Science, 10(1), 211–244. https://doi.org/10.1146/annurev.polisci.10.081205.095418
Villoria, M., & Jiménez, F. (2012). La corrupción en España (2004-2010): Datos, percepción y efectos / Corruption in Spain (2004-2010): Data, Perception and Consequences. Reis, 138, 109–134.