“La mayoría de la gente es incapaz de acomodar su atención al vidrio y transparencia que es la obra de arte: en vez de esto, pasa al través de ella sin fijarse y a revolcarse apasionadamente en la realidad humana que en la obra está aludida”.1
La deshumanización del arte. José Ortega y Gaset (1925)
- 2.1 Measuring news media
- 2.2 Measuring social media
- 2.3 Measuring public opinion
- 2.4 Agenda setting
- 2.5 Summary of findings
News and social media construct reality, or at least the reality we as a society know, and contribute to shaping people’s opinions. The world we know is what we see and learn through the media; news media are the lens through which we see reality. As Ortega y Gasset puts it regarding art, people tend to see news as the reality instead of understanding that news media offer a curated, filtered, and biased view of what happens in the world (Ortega y Gasset, 1925). It cannot be otherwise. Real-world facts have to be selected to offer the public an affordable amount of information, in terms of number/quantity, to understand what is happening out there, unless we pretend to know everything that happens, which is not humanly possible2.
Many metaphors have been used to explain the difference between real-world facts and what is printed or narrated. Lippmann (1922) (cited in McCombs (2004) p. 3), around the same time as Ortega y Gasset, used, for example, Plato’s Allegory of the Cave: “how indirectly we know the environment in which nevertheless we live, but that whatever we believe to be a true picture, we treat as if it were the environment itself”. In Ortega y Gasset’s analogy, the shadows would be the news of a projected reality that is “out of sight, out of mind”, as Lippmann put it (Lippmann, 1922), in its chapter “The World Outside and the Pictures in Our Heads”. Lippmann’s much cited book set the basis for the development of agenda-setting theory five decades later with McCombs & Shaw’s (1972) article.
Most of the time, readers of newspapers or watchers of television news broadcasts are not able to differentiate what really happened from what they were told happened. It is not possible to distinguish between the event and the constructed mediated event; they are one and the same thing in our minds. As Luhman (2000, p. 1) puts it3 “Whatever we know about our society, or indeed about the world in which we live, we know through the mass media.”
This research is focused on how the transfer of the selection of issues and stories from the news and social media agenda influences the public agenda. The main channels of the mass media ecosystem, their characteristics, and how they interact with each other are analyzed with new tools to provide a more accurate picture of how they work. Related communication theories such as intermedia agenda-setting, second-level agenda-setting (attributes), third-level agenda-setting (network of issues), and framing are also revised.
This chapter examines these theories and existing literature and reviews various approaches to measure news media and social media channels. Each news and social media channel of interest is analyzed to extract their unique characteristics and how they are studied. Social media are analyzed separately from the rest of the news media channels in the 2.3 Measuring social media section, to address their particularities. In the databases presentation (chapter 8), Twitter is not analyzed independently, and its analysis is integrated as one more mass media channel.
2.1 Measuring news media #
To measure is one way of performing an analysis. “What gets counted counts”, claim Klein and D’Ignazio, citing the geographer Joni Seager (D’Ignazio & Klein, 2020). Similarly, measuring news coverage enables us to analyze and understand how news media work beyond the subjective (or preconceived) picture people build in their minds.
In the 16th-17th centuries in the West, news media consisted of what came to be known as newspapers (broadsheets, pamphlets, booklets). Information was printed, and when scholars got interested in “measuring information” centuries later, this equaled, in its most basic form, counting the number of news. Those looking for more accurate metrics could measure the length of the articles to get a more nuanced sense of what news media considered important. In the 20th century, with the introduction of new forms of mass communication, like radio and television, and more recently with the World Wide Web in the 1990s (with the 24 hour cycles of information flows), and the multiplication of new news media outlets4, it is, simply put, no longer possible to count news: It is not longer possible to get copies of several newspapers and count news stories.
The problem of measuring news media coverage in the digital era is related to the multiplicity of channels and the vast amount of data needed to gather the current media ecosystem. As said in the introduction to this chapter, to measure is to select which aspects of reality are to be studied, and for digital objects, this is a key question. Whereas scholars had in the past to decide which media sources to gather (local and national newspapers, television, radio, or magazines), the technical characteristics of digital media do not allow such a “simple” analysis. Although a front page of a printed newspaper (or a picture of it), or even a video recording of a television news broadcast, are—to the eyes of the researcher—similar in that they contain in themselves the information the researcher needs5, the content and look of a home page of an online news site in a given moment depends on the device where it is displayed or the user’s cookies, to name just a few key modifying characteristics. Home pages, as digital artifacts, are written on HTML, JavaScript, and CSS code that calls images, videos, and audio files, and it is not clear how they need to be preserved as images or video files.
With the availability of tools to gather and store information or publicly accessible news online archives (like those for television news or websites at archive.org), it is now possible to get more information than ever and automatize its processing. However, contrary to the general belief, not everything published is or can be archived, and not all the analysis can be automatized. Long-standing forms of publication such as printed newspapers are systematically archived, whereas others such as TV, radio, or websites have not yet consolidated archiving methods and established analysis methodologies. This situation makes the analyzing the current media ecosystem more complicated and fragile because it depends on the live gathering of published news. Otherwise, they would be forever lost for the analysis6.
While front pages of newspapers are unique and immutable daily pieces of information that condense the main stories and issues of the day, home pages of news sites are fluid, continuously updated spaces where news stories move during the day. Until recently, researchers have counted articles or surface area or news stories on front pages, generally using the total number of articles published by the news outlet instead of the selected articles on the front page. It is usually a question of the availability of the sources, and many researchers depend on existing archives of news stories to make their analysis.
Each news channel has its characteristics and needs to be properly archived. Some archiving methods are more than a century old, like e.g. those designed for printed daily newspapers, while others (TV) started in the 1960s; others like online news are even more recent. The news media channels, and the elements within those channels, analyzed in this research, are the following:
- Newspaper front pages (Sec. 2.1.1)
- Home pages of online newspapers (Sec. 2.1.2)
- Television Newscasts (Sec. 2.1.3)
2.1.1 Newspaper front pages #
This section draws extensively from the article in collaboration with Sasha Costanza-Chock PageOneX: New Approaches to Newspaper Front Page Analysis (Costanza-Chock & Rey-Mazón, 2016).
The front page is the most disputed/contested space in printed newspapers. Journalists want their news to be on the front page to acknowledge their work. The selection of front page news results from a careful process involving key players in the newsroom; the process must consider many circumstantial aspects such as newsworthiness, potential public interest, and past coverage. It sets the tone of the newspaper, and it is the piece of information that will be shared more broadly in other news media channels. It has been used extensively in numerous academic studies because of its availability and conciseness. The existing academic literature supports its use as a proxy to the entire media ecosystem, even in this digital era where some might expect a decline in its importance and impact. Front pages offer the possibility of time ‘freezing’ the ongoing and faster live coverage of events and allow other ways for interpreting news on another, more distant, historical level (Niemeyer, 2019)7.
Still relevant in the broader media ecosystem
Despite the spread of broadband internet and mobile devices, the rise in digital media literacies (Anderson et al., 2011), and the growth of social media use8, printed newspapers continue to have a significant role in organizing public and elite agendas (Costanza-Chock & Rey-Mazón, 2016). Traditional printed newspapers retain a great influence across the entire media ecosystem, even when circulation is declining in many countries, which indicates that their impact goes beyond direct readership.
Golan (2006) and Danielian & Reese (2012) analyzed intermedia agenda-setting relationships. They found that newspapers, magazines, and television newscasts tend to give a similar amount of space and time to stories and demonstrated The News York Time’s agenda-setting role, especially for television news. McCombs (2004) found that the appearance of stories on the front page of The New York Times can frequently legitimate a topic newsworthy; to some extent, it can be considered that appearing on page one of the New York Times is the news itself: “I made it to the front page of the NYT”. Boyle (2001) also demonstrated that printed newspapers had a strong agenda-setting effect on TV networks, in the same way that McCombs et al. (2000) found that newspapers influenced the agendas of TV and radio broadcasts. Breed (1955) demonstrated how large metropolitan newspapers influenced the agenda of smaller local newspapers. Newspaper coverage also plays an important agenda-setting role for blogs and social media.
Front pages of daily newspapers are still powerful indicators of the prominence provided to a given news story and drivers of attention to all the other media channels across the media ecosystem. They are displayed and commented on television and radio news programs. In the last television news programs of the day and early morning radio news broadcasts, they are used as an indicator of what other media outlets find relevant. At the same time, front pages are the subject of journalist analysis. The news selection and framing of other news media outlets are considered the news. The front page is an “historiographical source as it condenses and compresses the first significations, interpretations and narratives of what is happening. They appear, for example, in television newscasts or on websites that offer press reviews. Moreover, this re-use is not a new ‘digital’ phenomenon, but a common pattern in journalistic narratives” (Niemeyer, 2019, p. 3).
Communication and media scholars have studied the production of newspaper front pages, including how different social, cultural, political, economic, and interpersonal forces shape the editorial selection and prioritization of stories (Broder, 2000; Forrest, 1934; Gans, 1979). Given the well-known influence of this selection of news on the entire media ecosystem, newspaper editors dedicate time and resources to deciding what to highlight (Sumpter, 2000).
The front page is also a highly contested political space. For example, Álvarez-Peralta (2011) argues that front page analysis provides a more direct lens on a newspaper’s editorial line than the newspaper’s editorials. He notes that editorials are carefully constructed, public-facing documents that frame the opinions of the newspaper editors for a critical reading public. In contrast, analysis of the content and framing of front page stories provides access to the paper’s ‘hidden’ editorial stance (Álvarez-Peralta, 2015). Similarly, Reisner (1992) explains how newspaper editors select the stories that are more aligned with their ideological preferences9.
From column inches to percentage
The most basic measure to track news coverage is to count the amount of news, but more nuanced metrics such as surface area or percentage amount the total amount of news are also possible. In the 1980s, column-inch measurements gained great visibility thanks to the popularity of Manufacturing Consent (Herman & Chomsky, 1988), although already measuring surface area was not a new approach by then (Fig. 22). As early as 1928, Yeuell used it to measure the relative amount of space dedicated to different topics, employing column inches as the unit of measure: “a column inch is an item of news one inch long and the width of a column” (Yeuell, 1928, p. 92). To follow this methodology, researchers needed physical copies of the newspapers to measure the space devoted to specific topics or stories and input the measurements into a spreadsheet by hand. Yeuell not only measured the surface area dedicated by category, which provides a more detailed measure than the number of articles but also published the percentage of coverage dedicated to each category. This methodology made possible the comparison between different newspaper sizes and formats.
Herman and Chomsky used column-inch and other quantitative metrics like number of articles, number of front page articles, and number of editorials to provide empirical support for the ‘propaganda model’ of the news system. Content analysis techniques for news communication evolved and incorporated systematized coding instructions and intercoder reliability measures.
McLeod et al. (1974) calculated the total coverage by measuring the column inches (including headlines and pictures) on the front page, jump page, and in the editorial for six selected news items, also calculating the relative percentage of space dedicated to each of them. They showed that the ranking of the six issues they analyzed was essentially the same for both types of content. They also studied the adequacy of only using selected pages (front page, jump page) by comparing them with the total content of the newspaper to show that the sub-sampling did not reveal a critical revision of the close attention to the six issues. However, it could overestimate the attention to the main categories analyzed (honesty and Vietnam). Kim and Chung (2017) used the relative size stories on the front page to account for the different page sizes to compare The New York Times with six metropolitan national newspapers.
Communication scholars have developed studies that employ the number of articles on front pages. Boydstun (2006) categorized all The New York Times front page news stories for the 1998-2006 years based on a codebook developed by the Policy Agendas Project10. Wolfe et al. (2009) used Boydstun’s dataset and compared it with the full content of the newspaper and found that front page and full-paper coverage have significant differences, e.g., many elements that appear inside the paper may rarely or never appear on page one. Front pages cover different issues and fewer topics (less entropy, narrower scope) than the entire paper, although they note a strong positive correlation (r=+0.78) between front page coverage and full paper coverage of any given topic. Front pages are more event-driven and have a higher entry barrier that only allows “hot topics” to be displayed there. The full-paper analysis is needed to analyze less trending topics. The coverage of issues on the front page is more likely to repeat the previous day’s coverage (higher ‘friction’). Using the same methodology, Chaqués-Bonafont et al. (2015) categorized every news story on the front pages of the two leading Spanish daily newspapers (1996-2011) that is used in one of the case studies of the present dissertation.
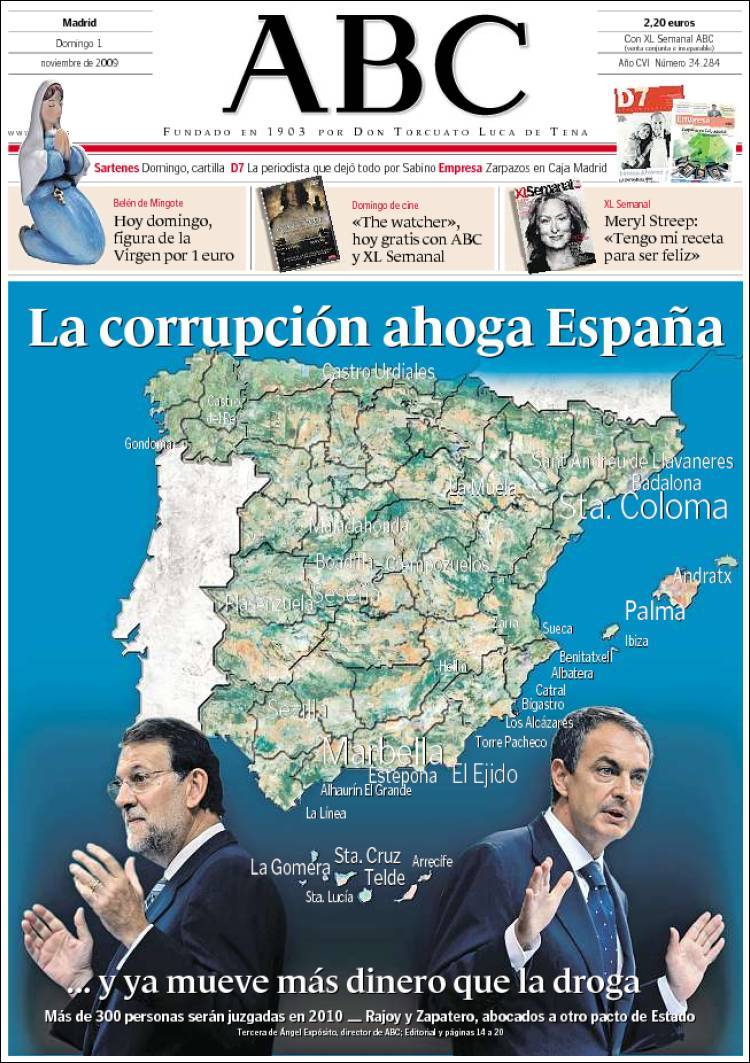
Di Tella & Franceschelli (2011) used the percentage of surface area dedicated to corruption scandals involving members of the national administration on the front pages of the four main newspapers in Argentina (1998-2007). Then, they compared the relative amount of coverage to government advertising in those newspapers and found a negative correlation. More government-paid advertising correlated with less corruption coverage in these news outlets, consistent with provincial officials’ reporting.
In their research using front pages of The New York Times to study network agenda setting, Saldaña and Ardèvol-Abreu (2016) used the Proquest Historical Newspapers database to search for all the stories that mentioned drugs in headlines, leads, or captions. They used the front page stories on the month before the Gallup poll to find out that there were agenda-setting effects according to the “network agenda-setting model” that considers the relation of the attributes and not only the amount of news coverage or percentage of answers.
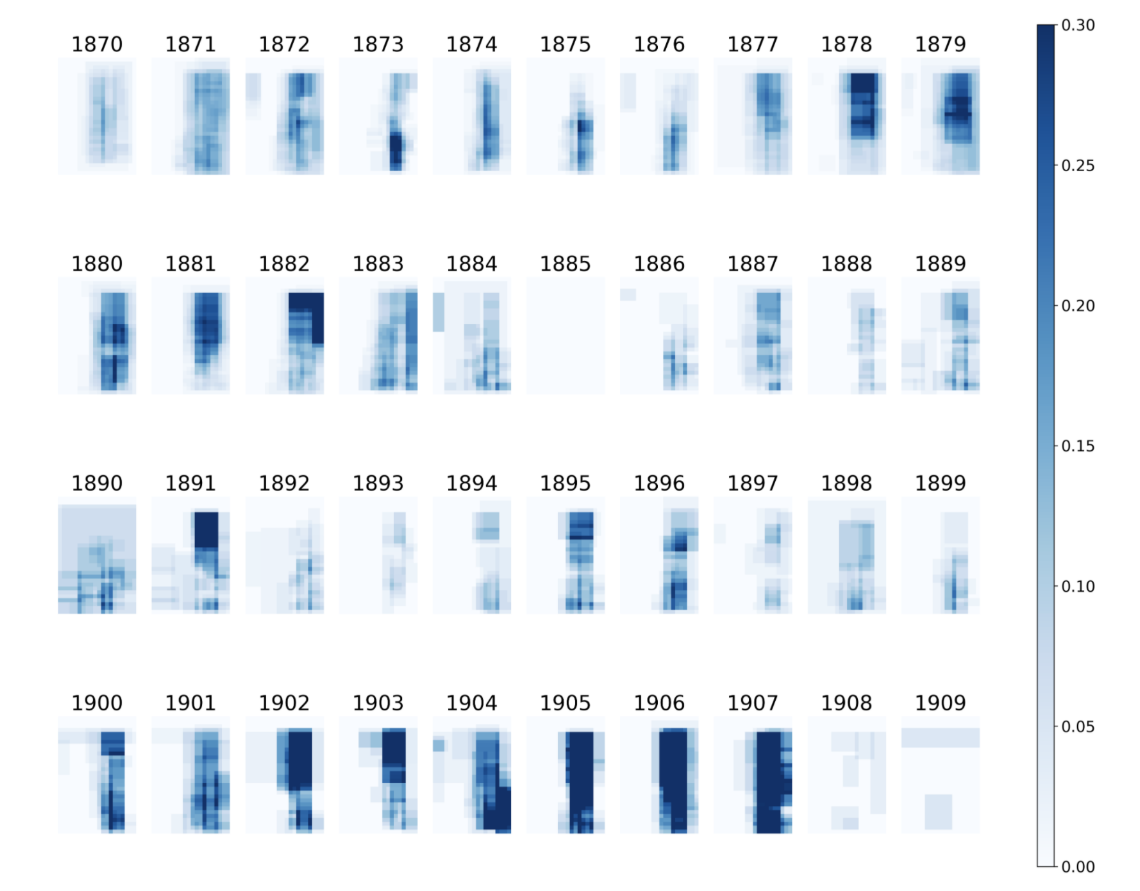
Massive analysis of front pages has also been done using machine learning for automated analysis. Sam Zhang, for example, has automated the analysis of newspaper front pages archived as PDF documents (https://github.com/samzhang111/frontpages). His software can detect news boundary boxes and parse text to create heatmaps of front pages related to a search query.
Germain Lee et al. (2021) used machine learning to analyze the visual layouts of multi-ethnic newspapers from the late 19th and early 20th century in the US from the Library of Congress’ Chronicling America archive instead of focusing on individual pieces of textual and visual content.
Figure 23: Location of news heatmap. From Sam Zhang.

Theory gaps and contributions
In the database section (7.5 Databases), I present Pageonex, the software developed to aid the coding, analysis, and visualization of newspaper front pages used in the present research and described in a previous article (Costanza-Chock & Rey-Mazón, 2016). This novel methodology automates parts of the analysis, simplifies others and enables to share the analysis online.
2.1.2 Home pages of online newspapers #
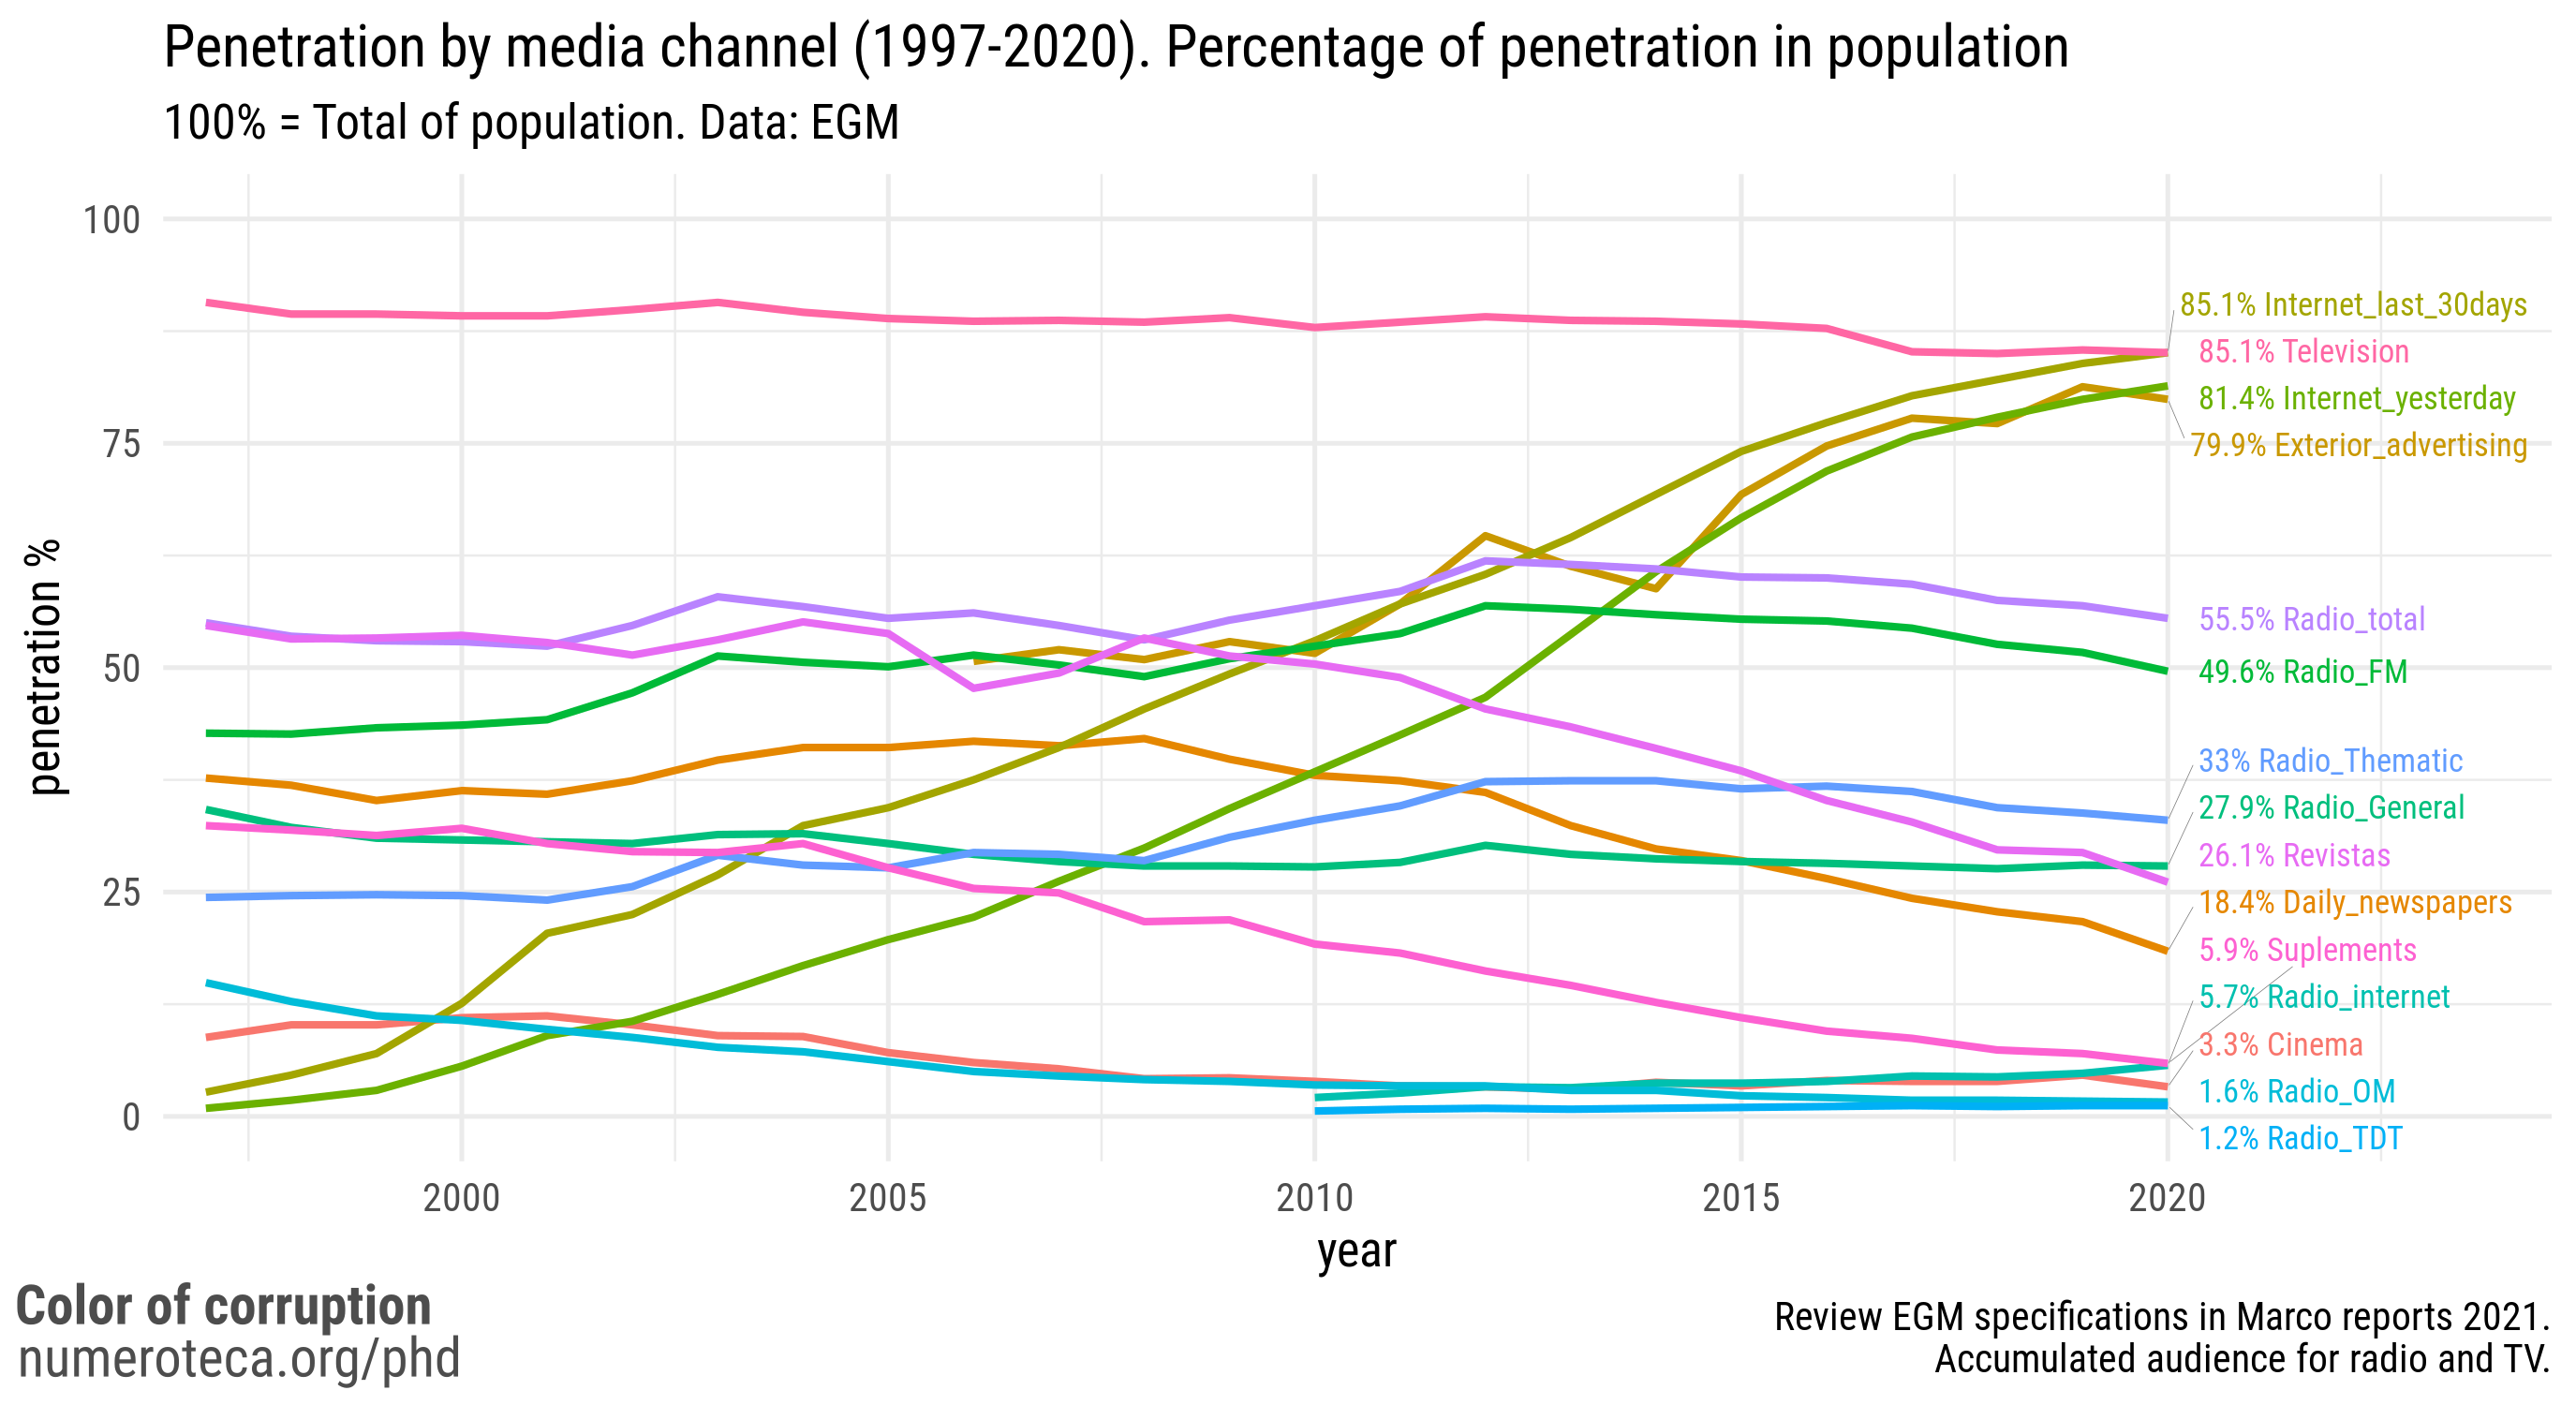
Research about online news sites, and particularly of their home pages, does not have such a long history (Li, 2013; Salaverría-Aliaga & Sancho, 2007), since it was not until the mid-1990s that many newspapers opened their first online versions of their printed version on the World Wide Web. Online news sites were static in the beginning and resembled their printed counterparts, but after some years, and thanks to a broader user base, they were converted into the current websites and principal media channels we know today, with penetration rates that match those of the television in countries like Spain, with 85.1% in 2020 (AIMC, 2021) for television and Internet use in the last 30 days. The rate of use seems to be arriving at its peak.
Since more than a decade ago, online news can now be characterized by its immediacy and interactivity (Karlsson & Strömbäck, 2010). Digital media are interactive because they allow more interaction of users than offline media and immediate. After all, the news cycle has been radically shortened (Singer, 2003). Karlsson and Strömbäck also noted the lack of research into news stories and that most of the analysis was conducted at the web site-level. Newsrooms need to publish news as quickly as possible and keep updating and revising content even once the public’s attention and visits have faded. Traditional research methods of content analysis face new problems in this rapidly changing environment and might be one reason for the scarcity of such analysis for this type of content (Gerd G. Kopper et al., 2000). The premise of content analysis relayed on the notion that content existed, was finished, and would be studied. However, this assumption is challenged by the current media ecosystem, where there are continuous edits (Deuze, 2008) in the news stories’ headlines and copy text.
Like printed front pages, home pages are highly contested spaces. If journalists and their news stories compete to make it to page one (Reisner, 1992), there is a similar struggle to make it to the top news stories on the home page. The selection of news on the home page also reveals the editorial choices of the news media. Digital space is also limited, and not all the news can fit, so the same battle to reach the front page arises.
With the emergence of social media, home pages might have lost some of their traffic, but they are still critical pieces of information, where media outlets select their most relevant information and contribute to redirecting substantial traffic to certain news stories by giving them prominence. At the same time, the home page is not the only way people can use to arrive to news stories since now people can (and do) use “side doors”, like Twitter or Facebook, to use Kirkland’s (2014) words.
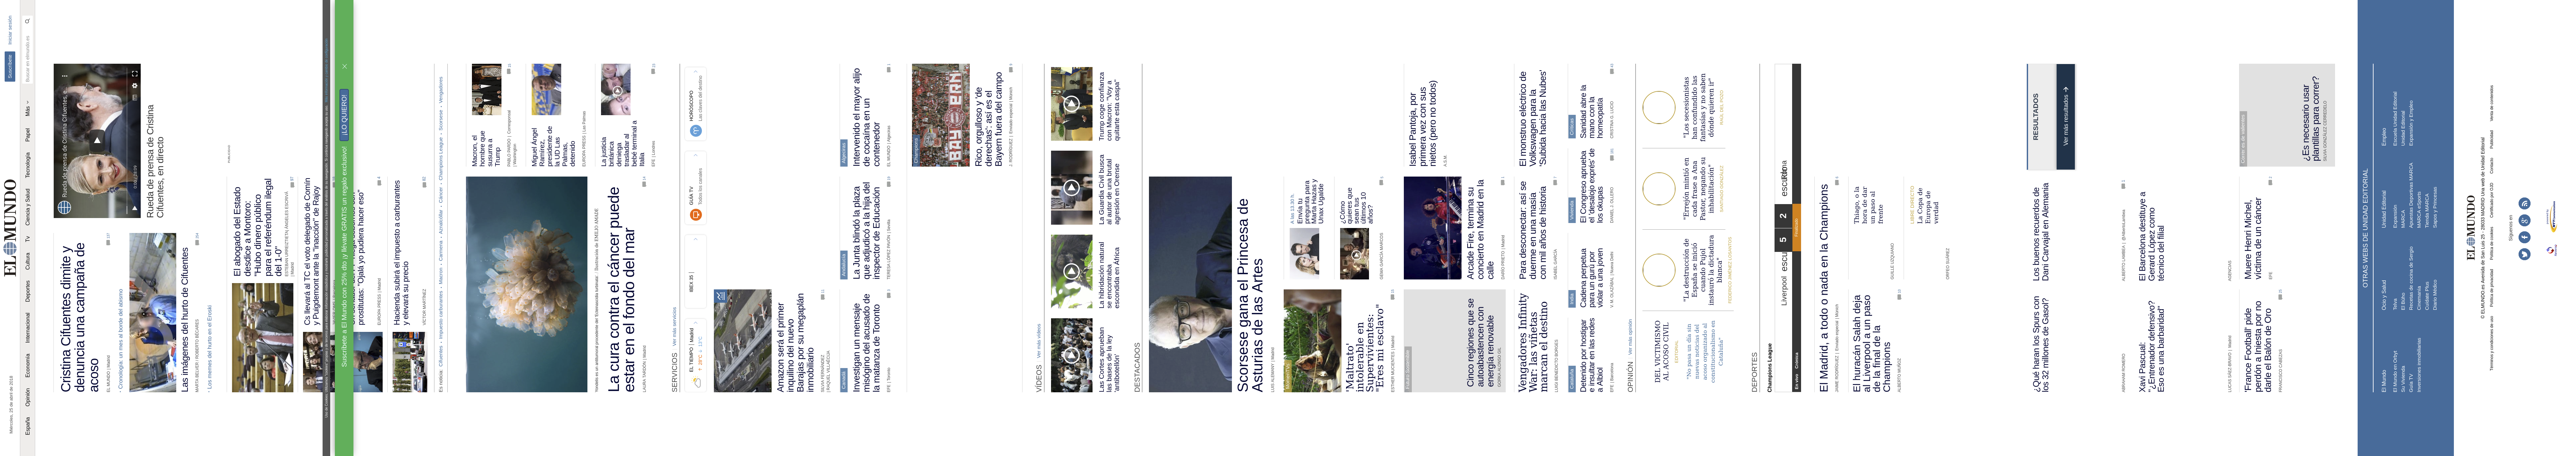
In recent years, with the emergence of paywalls, where users cannot read articles unless they pay a monthly or daily fee or have an account, or in some cases, can only read a limited amount of articles per month, images, and headlines (and subheads) in the home pages are the only pieces of information non-subscribers can access. This behavior resembles the experience of the quick view that readers experimented with printed front pages when they glanced above the fold news in a newspaper kiosk. A quick view of the top news of multiple home pages might be a way to get a broad picture of what media outlets are selecting as important to try to understand the news media agenda.
In 2014, an internal leaked report on digital innovation from The New York Times (Abbruzzese, 2014; Benton, 2014) reflected on the way the digital media environment has changed the media ecosystem:
“Each night, we printed our best work. Then we loaded it onto trucks to drive it to cities and towns. Then we enlisted kids to bike from house to house to deliver our papers to readers’ doorsteps. For non-subscribers, we dropped off bundles of papers at corner stores and newspaper racks, and painstakingly tracked sales to see where more copies were needed.
“Report on digital innovation”. The New York Times. 2014 (Abbruzzese, 2014)
We take this work for granted now, but our home delivery and single-sales efforts represented one of the most sophisticated consumer-outreach operations in history. But when the time came to put our journalism on the web, we adopted a much more passive approach. We published stories on our home page and assumed that most people would come to us”.
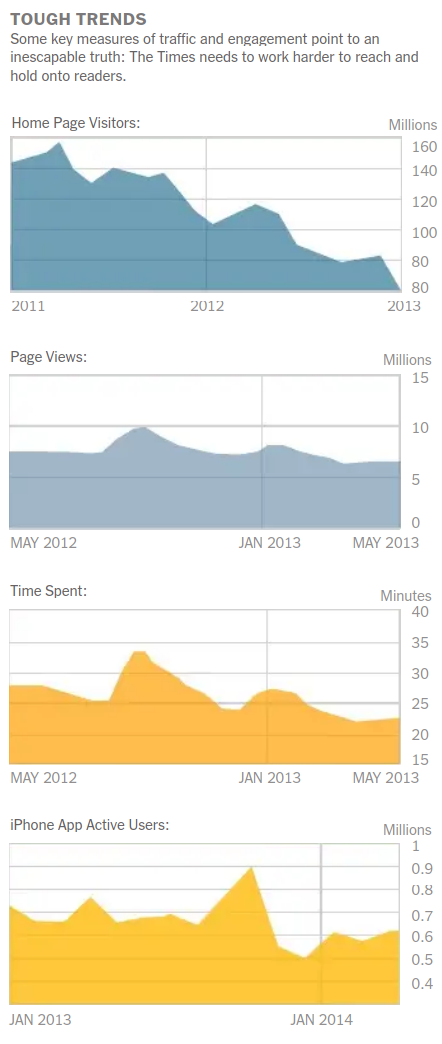
The report analyzed, among other vital issues, the change in the use of the home page, stating that visits to the home page had fallen 50 percent in the period 2011-2013, and also referring to the need to reorganize the newsroom from a “print-first” to a “digital-first” strategy.
This report made some journalists certify the death of the homepage, or at least a change in how home pages were traditionally conceived (Kirkland, 2014). For these two years, 2011-2013, the page views remained fairly steady at their website, so the loss of visits to the homepage was related to the way visitors accessed their site, which might indicate a growth of visits via social media. The website still had 80 million monthly visits, nevertheless. The home page had been, until then, their main “tool for getting our journalism to readers, but its impact is waning. Only a third of our readers ever visit it”, the report stated. Kirkland (2014) stated that news outlets were trying to find ways to retain readers after visiting an article page by creating homepage-like sections at the bottom of their stories. Other strategies involved the creation of an infinite scroll of stories.
In conclusion, homepages in online news sites are less influential than before the emergence of Facebook and Twitter, but they are still relevant in the way they drive attention, which justifies the time and resources spent on them by newsrooms.
Power users, in Kirkland’s words, or “influencers” to use a more popular term, i.e., those who select the information and redistribute it on social media, also depend on the selection of news in the home pages or RSS feeds (Klein, 2014). These users might be a small elite group but can influence many, in the same way, elite/legacy media influence other smaller media.
Other community-based social news networking services such as Reddit in the USA, and meneame.net in Spain, also drive social media traffic to online news media. On these sites, users suggest URLs that other users can up-vote. The most popular stories are highlighted on the home page and can bring significant traffic to news stories that had otherwise passed unnoticed. News that get popular on these sites can be re-shared on social media and re-broadcast by news media, starting the sharing cycle again.
Bookmarking and URL-typing are other ways that people can use to arrive at news stories. People can have a news site bookmarked and visit it with a click. To access the news sites, people can reload an existing loaded home page, type the URL of the newspaper (using auto-complete features), click on a bookmark or search for the name of the newspaper in a popular search engine.
Home pages maintain the attractiveness of the curated selection of news on front pages. Readers find value in this careful selection of stories by each news outlet. A similar content selection to that of printed front pages (Álvarez-Peralta, 2015; Reisner, 1992) is expected. The editorial decisions of both media pieces, online and printed, emerge from the same newsroom, though with different characteristics. When studying homepages, other variables will come into play, like live decisions by web editors to change the news position or wording of headlines, depending on live coverage events, availability of information, web statistics11 –low or high traffic that news stories receive– or how news stories are being shared in the social media sphere/networks.
The existing literature has adopted the 24/7 news cycle to describe/name the current constant fluid news media dynamics (Lin & Atkin, 2014; Rosenberg & Feldman, 2008). News sites are continuously available. Readers can visit them when they want. International/worldwide cable news or wire services are also continuously available and provide constant news feeds. News television channels broadcast 24/7, but many newsrooms are not always available. Only very big news outlets have editorial teams that are truly operative 24 hours a day.
Results of the present research show how home pages are edited continuously every hour, but there are usually massive replacements of articles on the home page once or twice a day. Results also show periods where the page remains almost static, i.e., without almost no updates during certain times, in particular at night (see Sec. 10.4).
Freezing the moment
The academic literature also examined capturing and analyzing digital content. This type of research involves gathering and analyzing news sites and has to face the rapidly changing environment of digital technologies and user interfaces, and the vast amount of data that can be potentially stored. News sites, either single news stories or home pages, can be captured in many formats and methods: image screenshots, PDF, RSS feed, and automated downloading. All of these methods have the common problem that they unavoidably simplify the original digital object (Karlsson & Strömbäck, 2010), so depending on the objective of the research, a different method should be employed and the sampling rate adjusted.
Websites use HTML language (Hypertext Markup Language), the standard markup language employed to display documents in web browsers in the World Wide Wide. The HTML code, and other technologies such as JavaScript and CSS (Cascading Style Sheets) form what users see when visiting a website on their browsers or mobile apps.
Different automated projects have been devoted to capturing the fluid ecosystem of online news. The discontinued NewsDiffs initiative (http://newsdiffs.org) tracked online news changes over time to build a publicly accessible dataset of changes/edits in news stories. The Wayback Machine project (https://web.archive.org) of the Internet Archive is a digital archive that preserves archive copies of web pages, including many news sites ones. All of them face the same challenge regarding the sampling rate.
Coche (2015) used content analysis of the home sites of the top 2 news sites in four countries to study the gender gap in sports news coverage. Her manual analysis involved sampling days and times, collecting the home pages in 6-hour cycles (4 per day) on the selected dates and saving them in three formats: Apple’s web archive, HTML, and PDF, using the software Web Snapper. This method resulted in 448 home pages archived and coded (2,930 news classified).
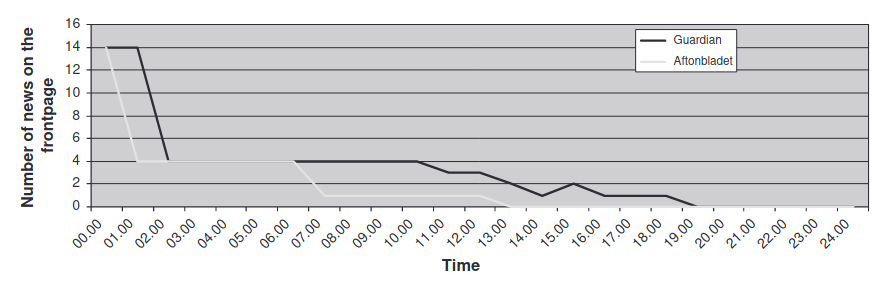
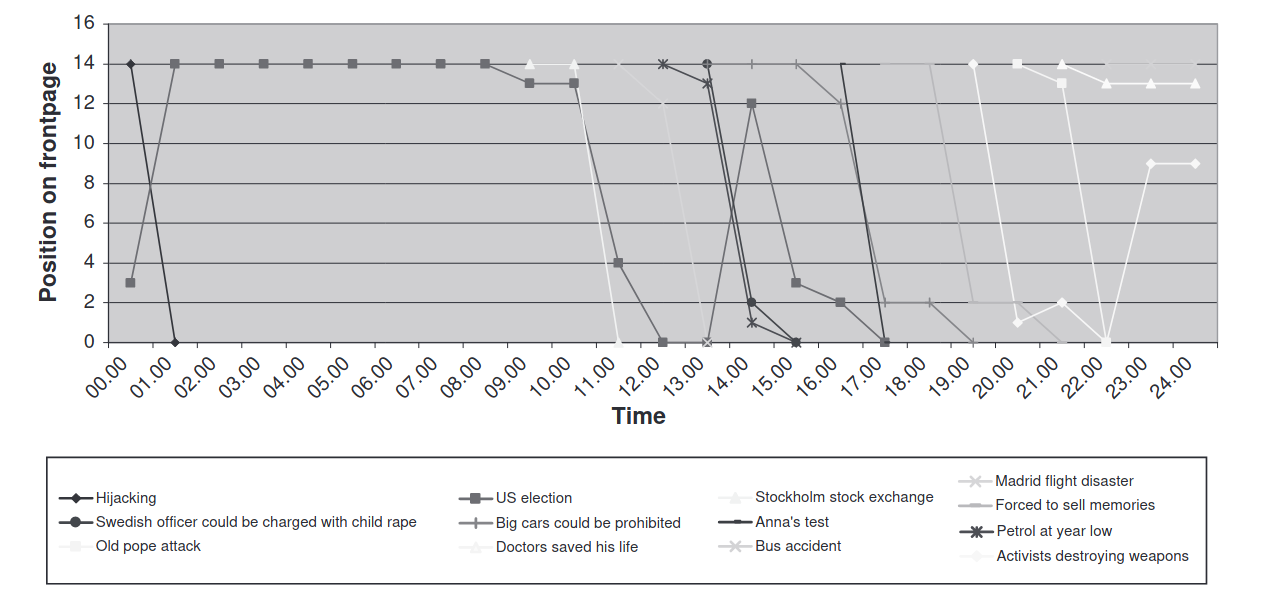
Karlsson & Strömbäck (2010) studied different methodologies to “freeze” the fluid digital news flow on websites. They analyzed how long the top 14 stories remained on the home page during one single day news cycle on two news sites. Their limited analysis showed that in 19 hours, all the news stories were gone from the front page. They could track the drop of the selected stories at 1-2 a.m., likely related to the refreshment of the entire home page. The selection of the top 14 stories is related to the number of top stories Guardian.co.uk had at the time. They also followed the position of the top stories, i.e., those that were the “top 1” on the front pages, represented on the following data visualizations:
Home page, which home page? Limitations
Whereas front pages are unique objects12, home pages have many more formats depending on the location of the user, their customization features (automatic and non-automatic based on the user), user device13 (smartphone, tablet, desktop, and tablet), or if the visit is from the website or via a mobile application. This situation makes home page analysis more complex than that of paper copies. Some users could see stories as full-width pictures and leading text, while others accessing from mobile devices could only read a selection of the content with smaller images.
New native digital media, like Quartz or Medium, and now also legacy media, convert every article into a mini homepage, i.e., every article page has links and references to other relevant articles (Klein, 2014), to offer the reader more articles and sections and to try to keep the user in the website. Some news sites offer an infinite scroll14.
Theory gaps and contributions
The study of news sites home pages still presents challenges that need to be tackled. Most of the methodologies do not analyze the constant flow of news articles and its possible implication in the way readers receive the news. I present in Sec. 7.5 and in the Annex, Homepagex, a software and the method developed to overcome this for the present research. This novel method follows the position of the news items on the home page on various days to have a complete picture of news flows and news cycles on websites. The methodology combines database building features (web scraping the home pages hourly) and automated content analysis.
2.1.3 Television Newscasts #
“But if we briefly consider the natural history of most issues, the larger capacity of daily newspapers relative to television news means that audiences often have longer period of time to lean the newspaper agenda. Television news is more like the front section of the newspaper.”
(M. McCombs, 2004, p. 49).

Television newscasts have been used in communication studies as a proxy for the television agenda. By analyzing video recordings, abstracts, or subtitles (Althaus et al., 2002), scholars have researched news stories on television. In the US, archives like the Vanderbilt Television News archive, Lexis-Nexis, or the open access Internet Archive TV News (https://archive.org/details/tv) are based on captions or subtitles, which make newscasts searchable, and in some cases, watchable. Television channels in the USA are obliged to publish their content with captions, so those captions can be used to archive the videos and make them searchable. In Spain, the Fundación Ciudadana Civio (2022) has recently published a dataset of television newscasts of the public-service broadcast television network in Spain (RTVE) called Verba, which has allowed television analysis on public television (Arévalo Salinas et al., 2021).
Generally speaking, television channels show a mix of programs in which newscasts are included. Two or three times a day, news programs condense the news agenda in 30-60 minutes. Like the limited space of the front pages, on-air time is here highly contested, and only a few news can be included. News programs usually start with a summary that highlights what will be broadcast and that can be eventually used to detect the selection of the selected issues so that it can be considered the front page of the most important news items of the newscast. Time dedicated to a story and its position in the total ranking of news are indicators of its salience. Measuring TV news is, therefore, a question of counting the number of news stories, length and position within the news program.
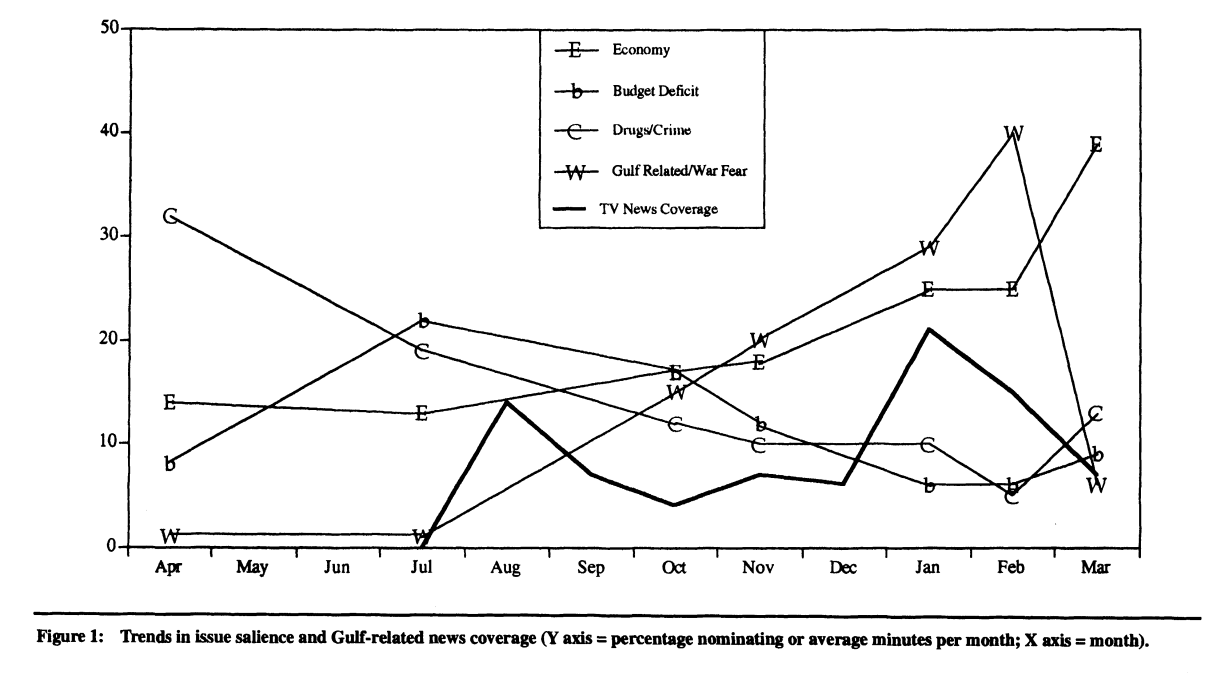
Iyengar & Simon (1993) used the relative duration of news stories in television newscasts to analyze news coverage about the Gulf war on ABC network: “the average amount of Gulf-related coverage per month was then calculated by summing the total number of minutes from that month’s sampled broadcasts and dividing by the number of reports sampled. The proportion of news coverage allocated to the Gulf was determined by dividing the coverage of the Gulf by all coverage” (p. 371) (Fig. 13).
Hester & Gibson (2003) studied the second level agenda setting (attributes) about economic news using ABC World News Tonight broadcasts and the front page of The New York Times (1998-2002). The television newscasts and front-page stories to conduct the analysis were selected using a search word query in the Lexis-Nexis database and then coded manually according to favorable or unfavorable framing.
Watt et al. (1993) studied network news coverage coded from daily entries in the Television Index and Abstracts from the Vanderbilt Television News Archives. Each story was coded for prominence features: the amount of time devoted to the story, whether film or videotape footage was shown, time placement within the broadcast, and the identifying sentence describing the story content. They used a prominence formula adapted from Watt and can der Berg (1981):
Prominence: = (TPT – TNS) / TPT + DS / 150 + FF
where TPT is the total news program time (1,800 seconds), TNS is the time from the beginning of the story (in seconds), DSthe duration of the story (in seconds divided by 150, the typical length of a news story), FF the presence (0.5) or absence (0) of a film or video. Longer stories that appear nearer the beginning of the newscast, and use video footage, will have higher prominence scores.
Theory gaps and contributions
The analysis of television newscasts still has a lot of room for improvement, particularly the non-aggregated analysis (day to day) and its visual representation. In section 7.5, I present in VerbaR, the methodology I have developed to analyze TV newscasts visually, using the position of the sentences that match a certain word query. It uses Verba, the novel database of subtitles developed by Fundación Ciudadana Civio (2022).
2.2 Measuring social media #
Social networking sites are changing the current mass media landscape. The use of social media (also “social networks”), with the expansion of mobile devices and broadband Internet, has enabled the direct participation of citizens in the hyper-connected media ecosystem. Following boyd and Ellison, they are used in the present research as the “web-based services that allow individuals to (1) construct a public or semi-public profile within a bounded system, (2) articulate a list of other users with whom they share a connection, and (3) view and traverse their list of connections and those made by others within the system” (boyd & Ellison, 2007, p. 211).
As happened with the emergence of alternative media, like the surge of blogs in the early 2000s (Kelly, 2008), social networking platforms like Facebook and Twitter—to cite the most popular—have become relevant tools that drive an substantial amount of the Internet traffic and people’s attention. Compared to traditional news media consumption, social media users are no longer mere consumers but potential producers or re-distributors of stories and ideas. They are part of the new reader-writer culture and contribute to disseminating news and participate directly in the creation, selection, and framing of the stories, thus modifying the agenda-setting traditionally dominated by the mainstream media (Negroponte, 1996; Shirky, 2008; Sunstein, 2001).
Accordingly, analysis of social media messages has become a way to measure how social and political reality is constructed and framed. Following the emergence of blogs, scholars have used the content and relationships among users in social channels to analyze the role social media networks play in the media ecosystem.
Current social networking platforms can be classified according to the primary way they are meant to be used: they can be networking sites developed to connect people; media sharing platforms to share images, videos and texts; discussion platforms more focused on the conversation; book marking sites to help users organize and share URL; blogging platforms. This classification, however, offers only a simplified picture of the actual situation because each network evolves with time, resulting in a hybridization of features that make them share characteristics and features and become more similar. For example, a platform centered on short messages, like Twitter in the beginning, currently accepts the publication of images and videos15.
2.2.1 Measuring Twitter
Twitter is presented here separately from the other news media channels because of its special characteristics, but, in the database section 7.5, it is presented as one more mass media channel.
Twitter is a micro-blogging online social networking service where users can post short messages known as “tweets”. Messages were originally restricted to 140 characters, a limit that was doubled to 280 in November 2017. Users can follow each other to obtain “retweets” (i.e. re-broadcast existing published messages), or like tweets published by other users. By default, all messages are public and accessible, but access to them can be restricted by a user, making her account become private. Since its creation in 2006, Twitter has become one of the most popular social media websites and networks where users exchange information.
With time, Twitter has evolved and shares characteristics with news media channels. It features news stories, and it can be understood as a kind of “home page” of the most important stories (trending topics); the timeline can be a true list of the tweets in chronological order (all tweets from users followed by another user), or a selection by an algorithm of the more relevant tweets according to the user’s profile. Individuals and news media users, both news media accounts and journalists, coexists on Twitter with politicians and public and private organizations and companies. The main difference with other news media channels is its multi-directionality: all accounts can publish and re-share other messages.
Twitter is the preferred place for researchers because its openness and accessibility allow them to get the data and directly measure how information propagates (Ye & Wu, 2010; Zhao et al., 2011). For Driscoll and Walker, “Twitter is particularly compelling because(…) [i]n comparison to Facebook”, basically closed to the academic community, “tweets are small in size, public by default, numerous, and topically diverse”. It allows researchers “[w]ith little more than a laptop, an Internet connection, and a few lines of scripting code, (…) [to] aggregate several million tweets in a short period of time using widely-available, low-cost tools” (Driscoll & Walker, 2014, p. 1746).
Researchers use Twitter as a window to society (Bruns & Stieglitz, 2014). As several scholars have noted, some problems limit the utility of this type of research. Driscoll & Walker (2014, p. 1746) point to three recurring problems: the lack of reliable and reproducible data collection, the way Twitter is a system that is constantly changing, and that “researchers lack a common vocabulary for describing tweets and the metadata that accompany them”. It is important to use consistent terminology to enable comparison across different studies (Bruns & Burgess, 2011a, 2011b, 2012; Congosto Martínez, 2016; Howison et al., 2011).
Driscoll & Walker (2014) compared the three publicly accessible APIs (Search, REST, and Streaming API) with the real-time stream of tweets provided by the Gnip PowerTrack commercial service (Walker et al., 2013). The results showed that the Streaming API was suitable for longitudinal (i.e. over a more extended period) data collection and not so much for high traffic events due to the 50 tweets per second limit of this method. For massive and short events González-Bailón et al. (2012) also found out that Search API results are not a random sample of overall Twitter activity. Currently, the endpoint of the full-archive search in Twitter API version 2 limits to 300 requests per 15-minute window16 (Twitter, 2022). As discussed in the methodology section, in this research, t-hoarder and twarc software are used for Twitter data acquisition because they help interact easily with the Twitter API.
The “user timeline”, i.e., the list of messages tweeted or retweeted by the accounts followed by a user, is the place where users can find messages, but (relevant) tweets can be viewed in other ways:
- Users can see tweets in their chronological timeline. When user A follows user B, it’s likely that user B tweet will be displayed in the infinite scroll to user A, including original tweets and retweets. The emphasis likely has two reasons: (1) users that follow many other accounts will not read everything that is published (all the tweets of the people they follow), and (2) Twitter does not display all tweets.
- Users can see tweets in their recommended timeline. Twitter displays tweets that might interest the user based on recent activity or predefined settings. Note that this is different from the chronological timeline above.
- Tweets can be found in the “trending topics” section or by reviewing tweets in hashtags.
- Tweets can also be searched.
- Tweets are linked or embedded in other websites or social networking platforms.
This review about Twitter analysis is completed in section 7.3.4 Specifics of Twitter analysis.
Twitter as news media
As noted above, Twitter is a multidirectional communication channel where the general public –in Spain, 16.2% of adults had a Twitter account in 2019, according to the CIS barometer survey–, politicians, journalists, and news media exchange messages that contain ideas, images, videos, and news. The existing literature supports that Twitter is more “newsy” than other social media platforms, meaning that it resembles more an information-sharing than a social network (Cardenal et al., 2019), where news media are essential participants and drivers of attention. Nevertheless, whereas the other news media channels previously presented the voice of the news media as almost the only one (except for the commentaries on news websites and invited writers), Twitter provides a discussion or broadcasting platform for everyone. Users, be they persons, bots, institutions, or news media organizations, publish all their content in a shared, online space. In 2009, Kwak (2010) found that in the first years of Twitter, over 85% of the trending topics were related to breaking news or news related.
In the context of social mobilizations of the occupy movement in the USA, Nahon et al. (2013) found that Twitter activity depends on the type of planned/unplanned event or on who the event promoter is (similar to news media and blogs activity and the way they interact). Rogstad (2016) analyzed the intermedia agenda setting between top tweets and headline news in Norwegian to find that Twitter and mainstream media were consistent on the salience of many issues of the agenda, but not entirely, with the microblogging platform also paying attention to overlooked issues like the environment or gender equality. The study also suggested that Twitter contributed to the expansion of the traditional elite that influenced the agenda.
Thus, for specific issues like the social mobilizations of the indignados movement in Spain or the occupy movement already mentioned, Twitter seems more sensitive to social movement mobilizations and might create the conditions for them to be covered by mainstream news media.
2.3 Measuring public opinion #
Public opinion analysis tries to quantify the public agenda regarding the social, political, and economic situation. Since asking the entire population (of a country or the world) is impossible, personal interviews about specific and general perceptions are conducted to build the public agenda.
2.3.1 The most important problems #
There is a long tradition among scholars to use the ‘most important problem’ (MIP) question as an indicator to evaluate the public agenda in the agenda-setting literature (Funkhouser, 1973; M. McCombs & Shaw, 1972; Winter & Eyal, 1981). It has been available in the Gallup Poll since 1935, the most widely used and cited public opinion survey in the USA. For Tom Smith, the Gallup MIP series provide “a grand overview of social change, describes history from the perspective of the participants, and helps to define distinct historical periods and identify turning points” (Smith, 1985, p. 264). The possibility to follow single issue trends and cross-sectional analysis are some of the reasons that have made this data series popular.
Similarly, Spain’s Centro de Investigaciones Sociológicas (Center for Sociological Research, CIS) has been conducting monthly surveys since 2000 (except in August) where a similar question is asked: “What do you think is the main problem in Spain today? And the second? And the third?” (¿Cuál es, a su juicio, el principal problema que existe actualmente en España? ¿Y el segundo? ¿Y el tercero?) (CIS barometer, December 2011). The main difference with the Gallup polls question is that it asks for the three most important problems, not just the first one, thus providing a more nuanced, not so restrictive view of the public agenda where more issues can emerge. Surveyors annotate the open-ended answers for the first, second, and third problems and then re-code the answers in pre-established categories. This type of open-ended question has not always been the case, and, for example, in the May 1992 survey, respondents had to select three issues from a list of 10. Smith analyzed the impact of this type of design changes in the Gallup MIP series, such as –”(1) variations in question wording, (2) number of responses allowed, (3) coding categories” to name some (Smith, 1980, p. 165)– to find that they did not have a substantial effect.
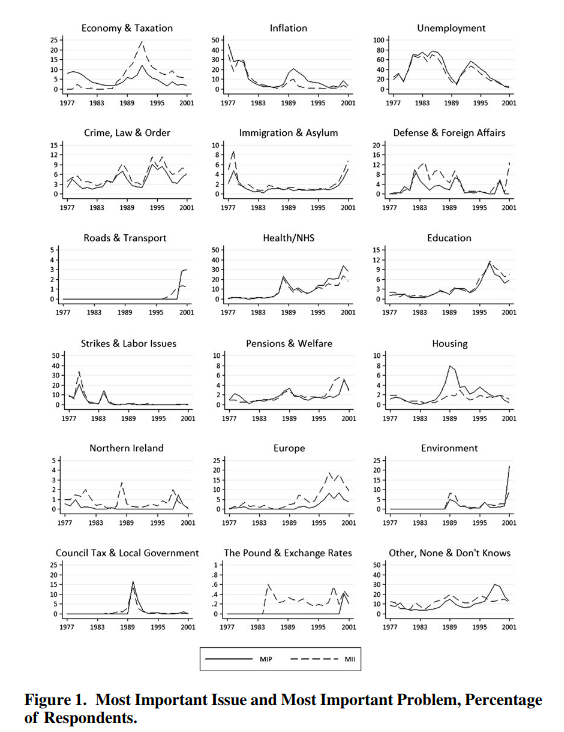
Jennings and Wlezien (2011) studied the relationship between the MIP and the MII (Most Important Issues) responses, something that is of particular interest for mass media and agenda-setting studies, where the number of news items by issue is compared usually to the MIP question to look for possible agenda-setting effects. They found that both trends are very similar, as can be seen in the following line chart:
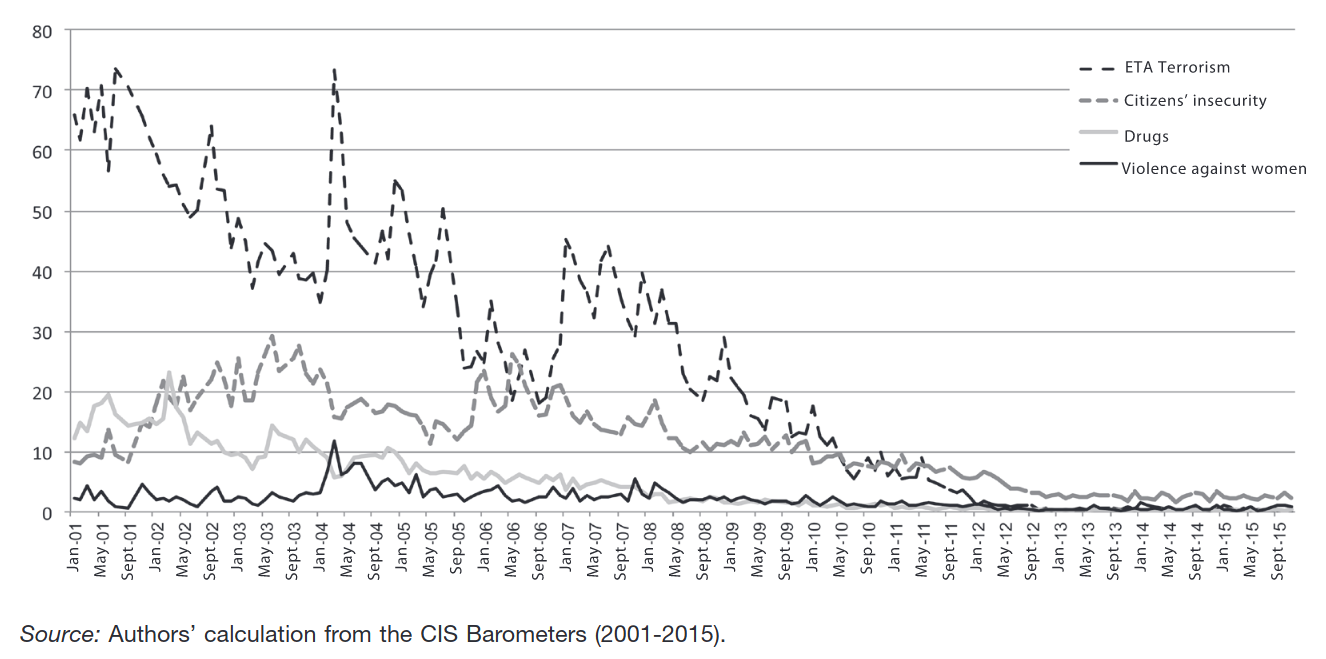
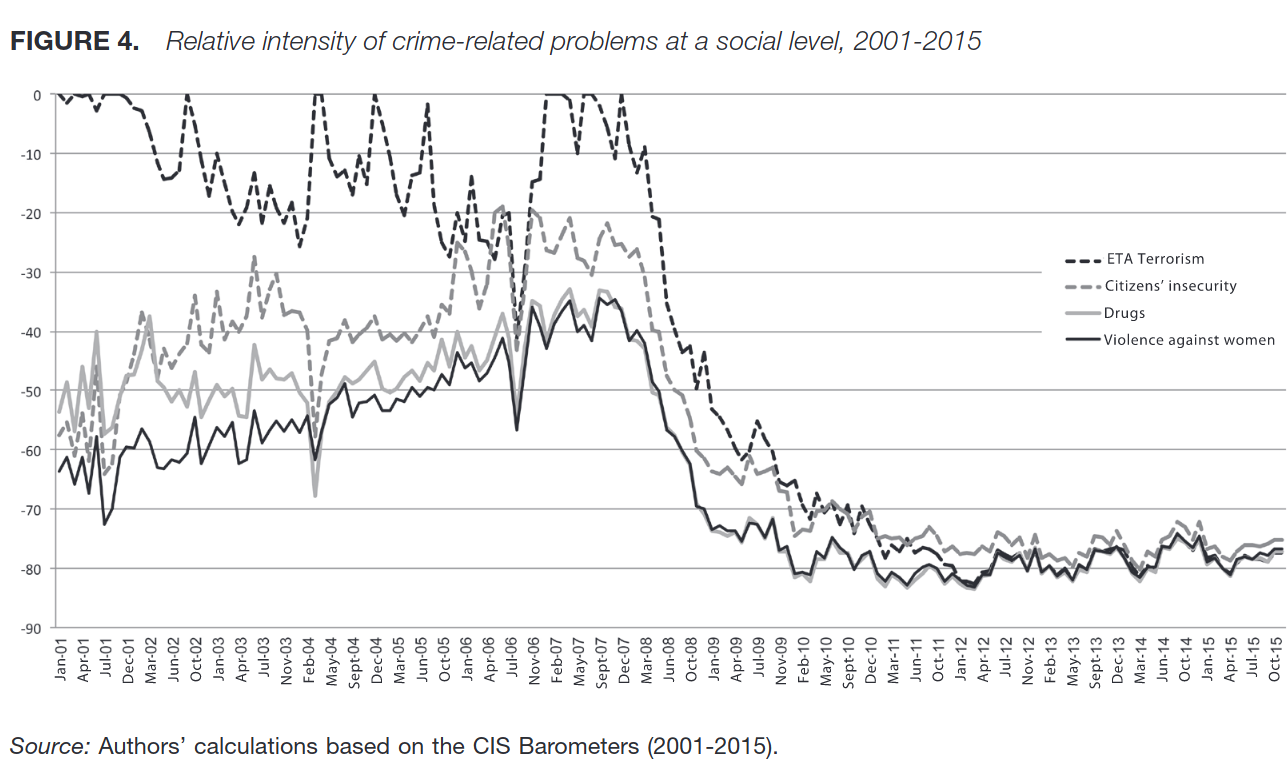
Researchers have explored different ways of using and representing the full agenda of issues resulting from the MIP responses. Caro Cabrera and Navarro Ardoy (2017), for example, while analyzing the fear of crime in CIS barometers, explained the different ways to use the MIP series: 1) aggregate intensity, the percentage of respondents who identified the same issue as a problem; 2) relative intensity, that compares the percentage of citizens who are concerned about an issue with their concern to other problems using different metrics such as (a) Aggregated view, percentage of responses that contain one of the problems; (b) Ranked issues; (c) Difference of answers to the problem with more answers in the survey. It is a measure that goes from 0 to minus 100.
2.3.2 Other metrics: Google search #
“Searches that users perform can be a good proxy for the public’s interests, concern or intentions, but these searches do not necessarily represent users’ opinions”.
(Matsa & Stocking, 2017)
The number of searches in services like Google Search, Bing, or Duckduckgo provides a proxy of people’s immediate interests. When data are available, like with Google Search, they should be used carefully as they are not representative of the entire population, and the results are not weighted like with public opinion surveys. Results for this metric would be more Internet and tech-savvy oriented, based on the type of user. Search engine results suggest a more active and immediate impulse than the one obtained from answering the MIP question in a CIS barometer survey, earlier mentioned.
Search engine streams are neither news media nor social media. They do not comply with the earlier described definitions, e.g. (boyd & Ellison, 2007). However, they are a good indicator of social responses and dynamics, provide a good proxy of people’s response to living events, and are the “entry gate” to access information to many users. Moreover, search engines have become gateways where users start browsing information on the Internet.
One of the products in their suite, Google Trends, is a free online data service that features real-time and archive search data from the Google Search engine17. Data, as far back as 2004, can be filtered by region and country and are provided on a 0-100 scale for the selected period. Data disaggregation depends on the time analyzed: hours for several days or weeks for more extended periods. According to the Google Trends page: “Numbers represent search interest relative to the highest point on the chart for the given region and time. A value of 100 is the peak popularity for the term. A value of 50 means that the term is half as popular. A score of 0 means that there was not enough data for this term”. Google Trends use a sample of the total amount of searches to provide the results18.
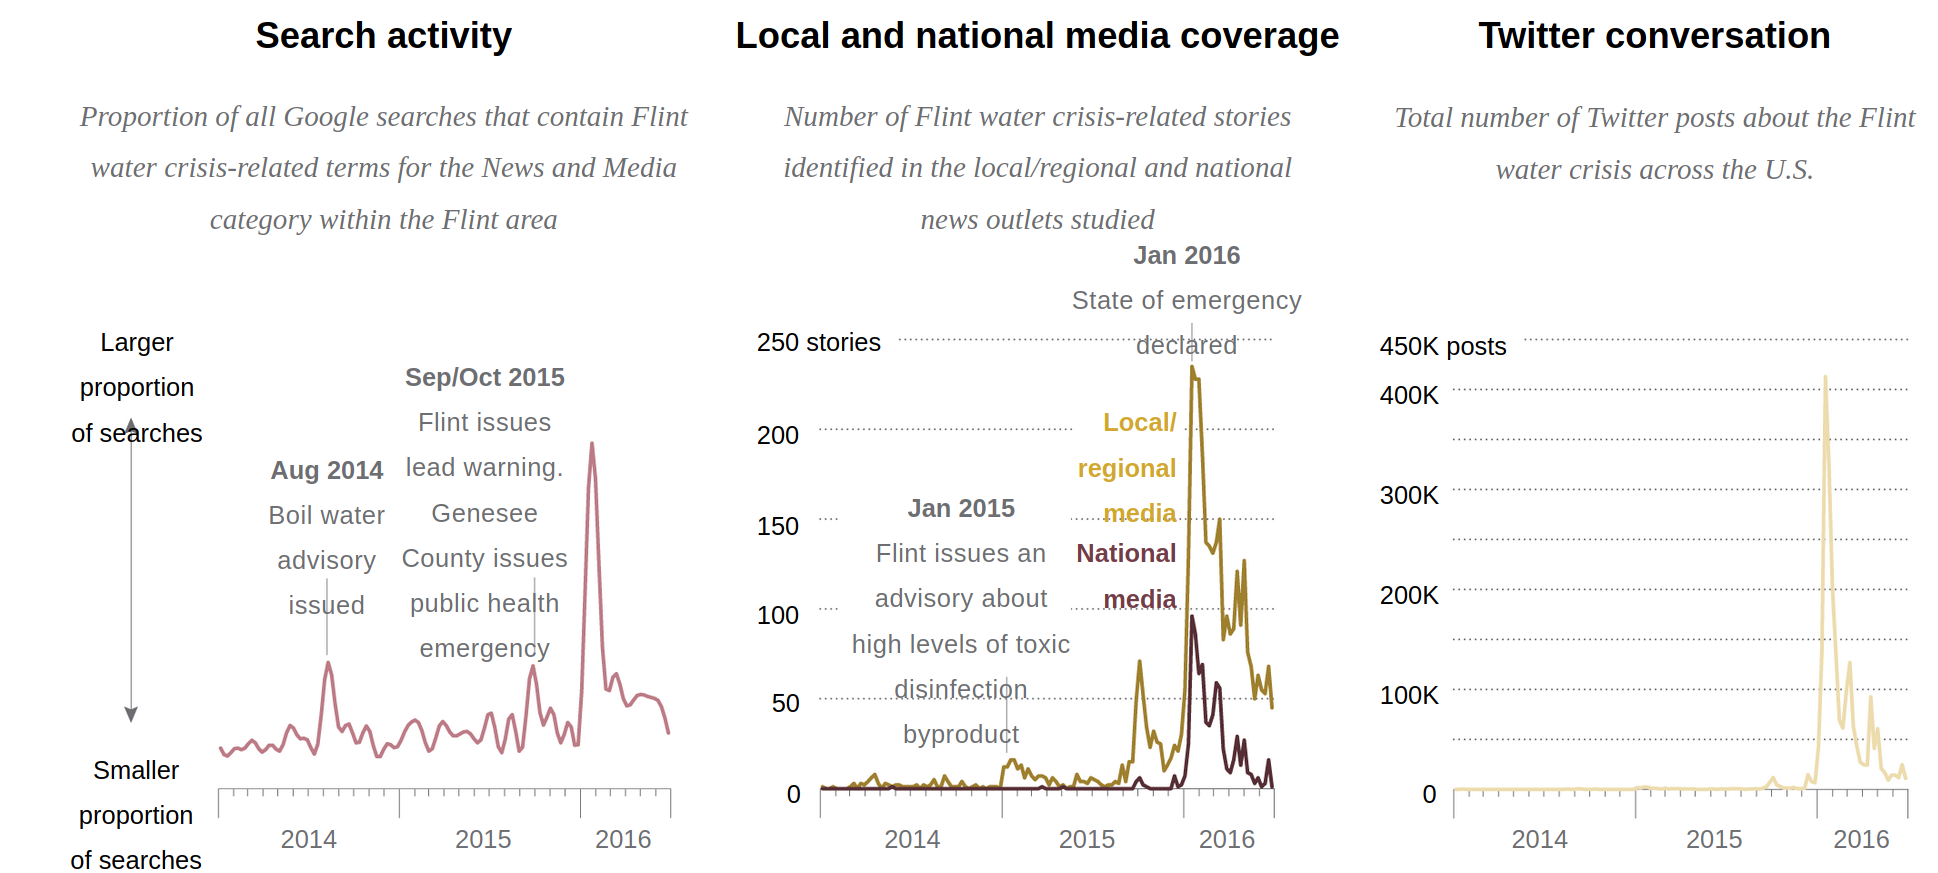
Matsa et al. (2017) showed the power of aggregated search data behavior. They showed that people in Flint in the state of Michigan in the USA “were searching for information about their water before the government recognized the contamination and before local and regional news media coverage intensified beyond a handful of stories related to the initial switch of the water supply. And, while news was the first type of information people searched for, questions about personal and public health implications soon came to the forefront.(…) Even before the water crisis had started to unfold, residents of Flint had begun searching for information about their water at increased rates – largely preceding both government notice and heightened regional news coverage.”
In their research, Matsa and co-workers used the Google Health API, which allows access to comparable data among regions (local data of Flint and for the whole Michigan state), which is not the case for the Google Trends data, that are normalized to a 0-100 scale. Normalized data can be indeed compared, but not their relative amount to the number of searches.
That is, Google search data allowed researchers to show how people’s interest came before widespread news coverage. In other key moments, they show how elevated news coverage and public search interest align with the story’s key moments. However, they also indicate that while, in most cases, search activity coincides with news media attention, the opposite, i.e., intensified news coverage, does not always translate into increased search activity. One explanation is that these new events happened in later phases of the story and consisted of incremental changes to the existing storylines, therefore not impacting search activity significantly (Fig. 36).
Granka (2010) gathered search queries of different soft (entertainment) and hard (substantive news issues) events and compared them with the volume of news coverage in print newspapers, television broadcasts, and web content (measured by counting the news items). She found that hard news search queries dropped off quickly, following the broadcast news coverage, whereas soft news declined at slower rates, paralleling the slow decline in coverage of blogs and web-only publications.
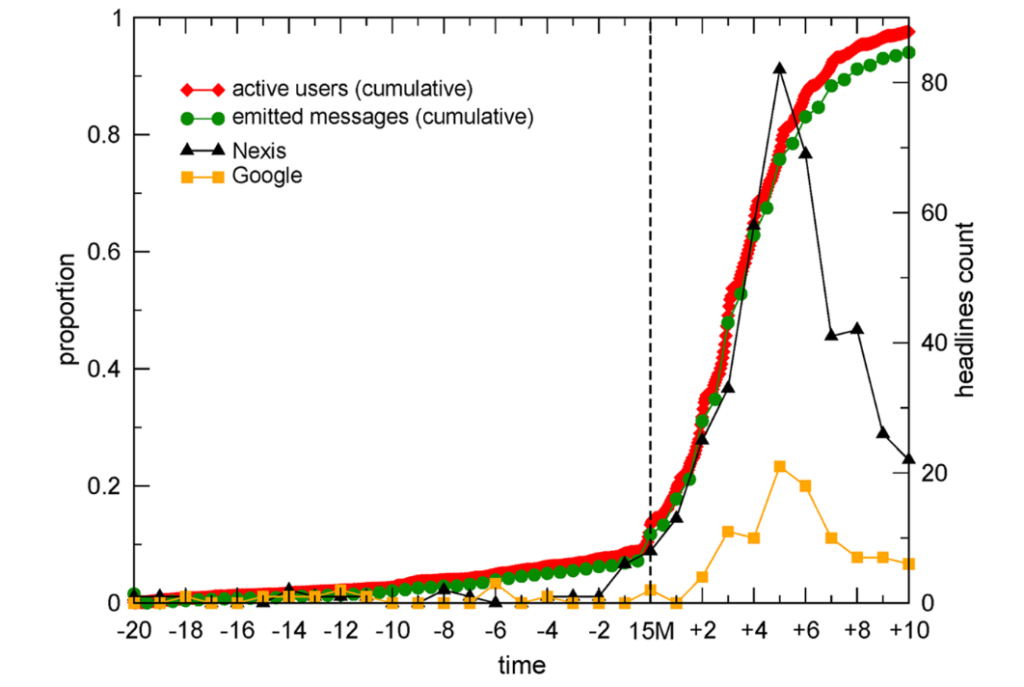
Researchers have used the accessible data of web searches to measure the importance addressed to specific stories (Ares & Hernández, 2017) or to track live events, like the evolution of diseases (Pelat et al., 2009). Mellon (2014) studied the issue salience with data from Google Trends. González-Bailón et al. (2013) compared Twitter, Lexis Nexis and Google search about the indignados movement in Spain (Fig. 37).
Theory gaps and contributions
Google Search (GS) has become popular as a proxy for public attention to certain issues, both in the academic and journalistic fields. However, there is still space for a more fine-grained analysis and to study what kind of impact GS data can record. In the present research, GS data are used in the longitudinal study (see Sec. 9.5) to show that it is more related to recent news and rapid forgetting. That is, it can be a good proxy for measuring immediate people’s interests. GS data the only non-mass media channel that serves as a proxy of mass media impact and immediate interest of the public are also used in the in-depth case study and show the same pattern of correlation as the rest of the other media channels: great synchronicity and redundancy between all the mass media channels for the average daily values (see Sec. 10.6.1). I show how, in the absence of daily public opinion data, search engine patterns are an excellent proxy to measure the concerns or, at least, the immediate interests of part of the society.
2.4 Agenda-setting #
“It may not be successful much of the time in telling people what to think, but it is stunningly successful in telling its readers what to think about”. (Cohem, 1963)
Mainstream media determine what is important and what is not by selecting and framing stories and shaping public opinion. This phenomenon is called agenda-setting in communication theory. Research shows that news media have been successful in telling people what to think about, although maybe not that successful in telling audiences what to think (Cohen, 1963). Until recently, mainstream media meant principally books, newspapers, magazines, radio, and television, the latter classified as news media. Included under the definition of ‘mass media’ is the dissemination of this media via broadcasting (Luhmann, 2000).
Lazarsfeld (1944), who interviewed the same group of 600 people at different times during the 1940 USA presidential election in Erie County, Ohio, found that people acquired information from the mass media. However, not enough evidence to support important effects on opinion and attitudes. This study can be considered a precursor of agenda-setting research, which was established in 1972 (M. McCombs & Shaw, 1972) as we know and name it. It was based on the analysis of news coverage and surveys in Chapel Hill during the 1968 presidential elections. The theory has evolved much since its initial conception to prove the role of news media in the transference of salience from the mainstream media to the public agenda, providing successful explanations of events in multiple countries and situations (M. McCombs, 2004). It has studied, among other issues, the transference of salience from the news agenda to the public agenda, which is just a subtopic of the broader agenda-setting research. It has evolved since then to the second and third level agenda-setting –from attribute salience to networked agenda setting– and explored other related fields like intermedia agenda-setting, framing, cultivation theory, agenda-cutting, and agenda-melding, to cite a few.
Contrary to some interpretations, “agenda-setting theory”, which appeared at a time when mass communication theory was centered on the study of mass media attitudes and opinions in the 1940s and 1950s, did not say that the media was all-powerful but rather stressed their central role in configuring people’s minds. The theory emerged in a time when the “hypodermic needle” model19 was in place. As McLeod et al. put it, “they have diverged from an almost exclusive focus on direct persuasion and conversion effects to examining as criteria of effect other forms of overt behavior (e.g., voter turnout and political activity), knowledge gains and more subtle forms of cognitive change” (McLeod et al., 1974, p. 132).
In his 2004 review, McCombs tells the origins of the theory, starting with the classic, and much cited, book by Walter Lippmann of 1922, Public Opinion (Lippmann, 1922), whose first chapter (The World Outside and the Pictures in our Heads) which provide its conceptual basis. Drawing from McComb’s 2004 review, the phases of agenda-setting in history can be summarized in the following phases:
- Transfer of object salience (the 1970s).
- Contingent conditions that enhance or reduce agenda-setting effects (1970-1980).
- Attribute agenda-setting: moves from effects on attention to effects on comprehension.
- The introductions of other agendas (government, policy, other media, wire services). Media agenda as dependent variable: who sets the media agenda? (the early 1980s).
- Network agenda setting, when the network of issues is considered (the 2010s).
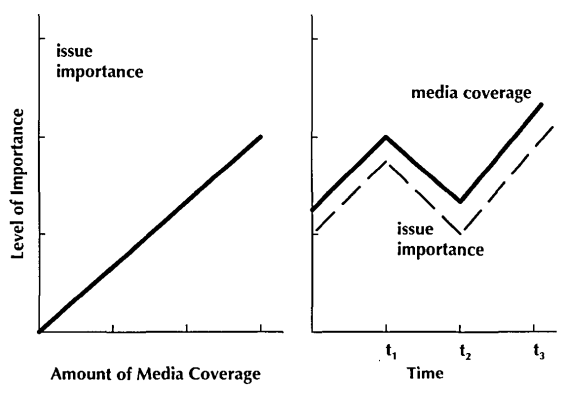
Most agenda-setting analyses assume a linear correlation between mass media attention and public opinion (Fig. 19). This type of correlation is implicit in most analyses using linear regression and calculating correlation coefficients – Pearson or Spearman’s rho– to measure the correspondence between data pairs. A few researchers have explored nonlinear relationship models (Brosius & Kepplinger, 1992; Watt et al., 1993) and warned about this implicit assumption of linear correlation in most previous studies. A linear model could fit the data many times, but others would require nonlinear approaches20.
The “Acapulco typology” (McCombs, 2004) presents four ways of conducting agenda-setting studies according to the intersection of two-dimensional pairs. The first classifies the research depending on the items analyzed to define the agenda –an entire set or narrowed to one single issue–, the second differentiates the ways of measuring the salience of items in the agenda – aggregated measures versus measures that describe individual responses.
| Measure of public salience | ||
| Focus of attention | Aggregate data | Individual data |
| Entire agenda | Perspective I Competition | Perspective II Automaton |
| Single item on agenda | Perspective III Natural history | Perspective IV Cognitive portrait |
The four perspectives in table 1 are summarized here for later reference: Perspective I analyzes the relation of the issues of the entire agenda, comparing the rank of issues in the news and public agenda as an aggregated value to establish the salience of items; Perspective II uses the individual agenda instead as a proxy for public opinion, and this model is a return to the hypodermic needle theory; Perspective III uses one issue of the agenda and compares it to the aggregated opinion values; Perspective IV focuses on an individual and on a single issue. It is used in experimental studies, where the salience of a single topic for an individual is measured before and after controlled media exposure, for example, in Kiousis et al. (1999).
Studying single issues: natural history
Agenda-setting perspective III “narrows the focus to a single issue on the agenda, but like perspective I uses aggregate measures to establish the salience of this item. Commonly, the measures of salience are the total number of news stories about the issue and the percentage of the public citing an issue as the most important problem facing the country. This perspective is named natural history because its focus is on the history of a single issue on the media and public agendas. In other words, the focus is on the degree of correspondence between the media agenda and the public agenda in the shifting salience of a single issue over time” (McCombs, 2004, p. 31-32).
Using this approach, Funkhouser (1972) and Zucker (1928), demonstrated how the agenda-setting effects depend largely on the kind of issues analyzed, if they are obtrusive, their novelty, the time it has been prominent in the media and other contingent variables mediate the strength of this effect like the need for orientation, or previous media exposure.
What follows is a series of concepts related to agenda-setting studies, together with a few examples: obtrusiveness, need for orientation, the novelty of topics, media exposure, control for reality, and framing.
Obtrusiveness
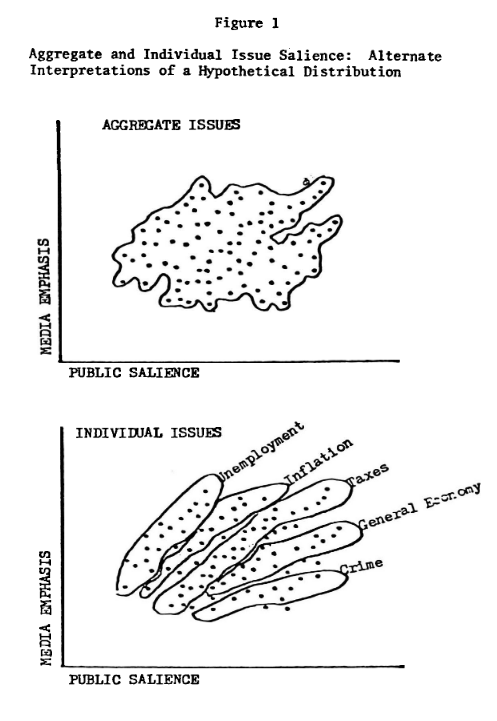
An issue is “obtrusive” if it can be known directly by the public, i.e., if the public can have first personal experience with it (e.g. conversations or direct experience). There are gray areas here, as obtrusive issues can become non-obtrusive or lay somewhere in a middle state. More obtrusive issues are (e.g. cost of living or unemployment), of which people can have direct experience in their daily lives; unobtrusive issues are known through the media. For example, political corruption (or corruption of politicians) is an unobtrusive issue, as all we know about it comes from the mass media. The aggregated calculation of correlation for various single issues of the agenda can lead to “negative correlations for the obtrusive issues were canceling out positive correlations for the unobtrusive issue” (Rogers et al., 1982, p. 2), as found it happened in Eyal (1980) doctoral dissertation. Figure 20 shows how the aggregated correlation in the scatter plot can be obscured if the single items are not considered.
Rogers et al. (1982) studied the agenda-setting effect of news media on three issues (inflation, unemployment, national unity) by counting the number of news stories in the front page of a newspaper in the previous 6 months to the survey, both cumulative coverage by month and each month separately. Their results show the great variability of the results of the correlations (Pearson) between previous coverage and public opinion depending on the months of news coverage before the survey. Two of the issues have reasons to be classified as obtrusive and unobtrusive, in contrast to “national unity” which is abstract and unobtrusive. “Unemployment” also obtained strong correlation results. These results should be observed carefully: only one newspaper was used (the Toronto Star), the analysis was carried out in only 4 six month periods (very limited N=4), and the amount of news is not relative to the total which is likely a poor measure for salience.
Need for orientation
“Need for orientation” is a psychological concept that “describes individual differences in the desire for orienting cues and background information” (M. McCombs & Valenzuela, 2021, p. 74). A person interested in a topic is likely to look for more information and be more influenced by mass media than someone who is not. The need for orientation for an individual is defined by two other concepts that occur sequentially and are related to the issues studied: relevance and uncertainty. Previous studies found that a combination of the high relevance of an issue and high uncertainty leads to stronger agenda-setting effects (Weaver, 1977). On the contrary, low “need for orientation” levels can result in a low correlation between news coverage and public opinion. Takeshita (1993) studied the agenda-setting effect of various issues. His findings showed a low correlation of +0.39 for different issues, but when he considered the 21% of the population with a high need for orientation, the correlation rose to +0.86.
Novelty
An issue’s novelty can help predict its agenda-setting effect’s strength (Watt et al., 1993). An unobtrusive issue might dissipate its influence on public opinion after a few years (Zucker, 1978). This might have relevance to the study of corruption, as we can see the decline in interest in the public agenda once the issue is not new anymore. New scandals might bring renewed attention, but old scandals might not bring new attention to a saturated media environment. “Issues that have received much coverage should show fewer agenda-setting effects than novel issues, as attention to coverage of habituated issues should be less than attention to novel issues” (Watt et al., 1993, p. 413).
Media exposure
The level of exposure to mainstream media is used as an indicator of more influenceability: more exposed to the media are more capable of being influenced. López-Escobar et al. (1996) compared levels of exposure to political information in newspapers and television news during local elections in Pamplona, Spain, in 1995, to find that the more exposure to the media agenda the greater, the transference of salience of both substantive and affective attributes.
McCombs et al. (2000) analyzed news media coverage and public opinion surveys to analyze the attributes (ideology/issue positions, biographical details, perceived qualifications, integrity and personality & image classified as positive, neutral, and negative) of the three candidates Aznar, González, and Anguita during the Spanish general elections in 199621. Increased exposure to news media resulted in “both in positive appraisals of other candidates and in negative appraisals of one’s preferred candidate” (McCombs & Valenzuela, 2021, p. 48).
Control for reality
“The inclusion of ‘reality’ is particularly significant contribution to the causal evidence of an agenda-setting effect upon the public by the media because it rebuts the contention of some critics of agenda-setting theory that both news coverage and audience concerns are simply reflection of events in the real world. (…) The media are far more than a conduit for the major events of the day. The media construct and present to the public a pseudo-environment that significantly shapes how the public views the world.” (McCombs. 2004, p. 23).
The inclusion of “reality” is of particular interest for the present research, as critics of our research can argue that public opinion and news media respond to the same real-world events, but our hypothesis is that all the information that people consume about corruption scandals are mediated one way or another.
Funkhouser (1973) studied the relations of news media coverage and public opinion for single issues in the 1960s in the USA –Vietnam war, race, and pollution – using Gallup polls and TV and newspapers coverage and compared it to real-world data: “it appears that the patterns of media coverage did not have a one-to-one relationship to the realities of any of the issues. Coverage of the Vietnam war, campus unrest, and urban riots peaked a year or two earlier than these events reached their climaxes” (p. 72). The correlation between the news and public agenda was +0.78 (Spearman correlation). What Funkhouser does is to “control for reality”, to see if the public perception is a direct influence of real-world events, as the critics of the agenda-setting theory postulate, or is influenced by the media, as their strong correlation suggests. He controls the number of troops and deaths for the case of the Vietnam War, but also for other issues like campus unrest and urban riots, to demonstrate that those issues arrive at their peaks years after the peak of the media coverage and public attention’s peaks. He elaborates two ways media attention operates and follows two distinct patterns: when they cover issues based on newsworthy and non-newsworthy events. For the first ones –war, urban riots, student unrest, crime– it “seemed to involve a sort of “adaptation” of the media to the stream of events, by which a pattern of events ceased to be “news” after a while” (ibid. p 73). For the second ones they seem to be “artificial news” that can have different forms: “(1) event summaries—situations that sum up non-newsworthy events in a newsworthy way, for example, the Surgeon General’s report in 1965 on the link between smoking and lung cancer; and (2) pseudo- events—events staged to be reported in the news, for example, Earth Day, the Women’s Lib demonstrations, and various civil rights and black militancy activities” (ibid. p 73).
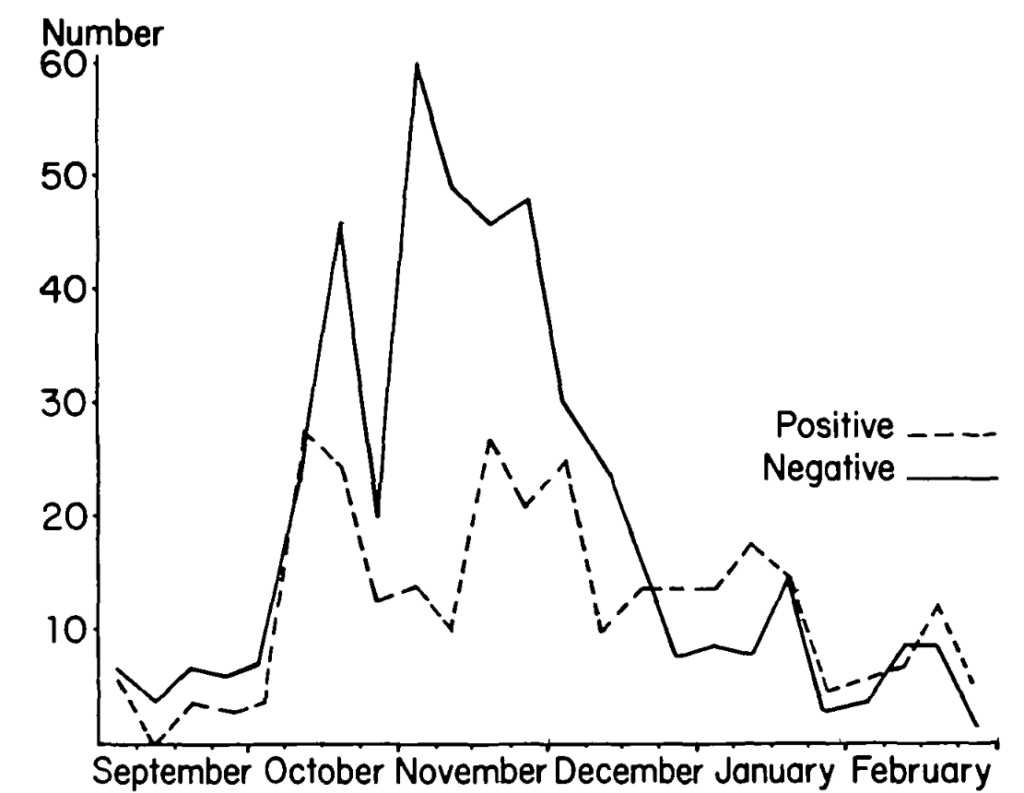
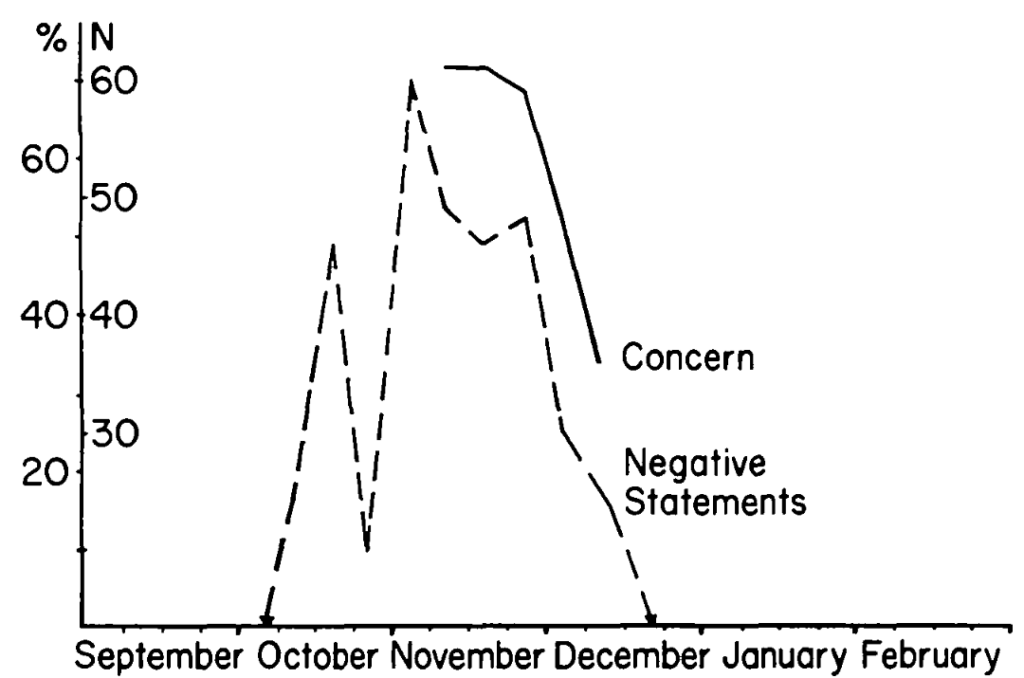
Similar behavior of how the media create attention, regardless of the actual situation with the oil prices, is what Kepplinger & Roth (1979) explained in their “Creating a Crisis: German Mass Media and Oil Supply in 1973-74” article, where they found that the increased coverage about the issue increased the demand of oil. They also studied the effect of negative framing and how it paralleled opinion concerns.
Gross and Aday (2003) found that exposure to local television had a strong agenda-setting effect in naming crime as an important problem in the city, while fear of crime was related to direct experience. Their study analyzed the impact of local TV news about crime in Washington, DC within the frameworks of agenda setting and cultivation theories. They controlled for TV exposure and used three measures to account for reality: direct experience as a victim of a crime, local neighborhood crime rates, and being the friend, neighbor, or relative of a crime victim. They found that “that local television news had an agenda-setting, but not a cultivation effect. People who watch a lot of local broadcast news are most likely to name crime the most important problem facing their city. Watching local television news does not, however, lead people to be more afraid of their neighborhoods or feel that they are likely to be victimized by crime” (p. 423). When analyzing for direct, or real world, experience they found that it had no agenda-setting effect but did explain fear of crime.
Framing
The second level agenda-setting studies the salience of attributes in issues or objects. If the first level is centered on the transference of salience of the main issues of the agenda, attribute agenda setting focuses on selecting and promoting certain attributes of an issue. In framing, the focus is on the “two ways of saying the same thing that produce different outcomes” (McCombs & Valenzuela, 2021, p.62), showing its origin in the framing as employed in photography and cinema: stylistic changes in perspective and camera angle and therefore relates also to page design and other graphical variables. When describing the same event, the selection of words, protagonists, and the emphasis in one part of the story or issue can give a positive or negative view and attack or a defense frame. Framing can refer to a particular frame in media content or the process of framing (McCombs, 2004).
Framing shapes our entire understanding of an issue and “call our attention to certain events and their underlying causes and consequences and direct our attention away from others. At the same time, they organize and make coherent and apparently diverse array of symbols, images and arguments, linking them through an underlying organizing idea that suggests what is at stake on the issue” (Ferree et al., 2002, p. 14). The framing of a problem or a story has a strong impact in how it is interpreted. It can impact our willingness to do something about it (or not).
In the comparative study between the USA and Germany (Ibid.), they classify ideas in news media stories about abortion and quantify the different framings (e.g. Women’s rights, Fetal life, Social justice, to name a few of the eight frames used) to analyze the use in each of the Pro, Anti or Neutral on abortion policy groups. Framing in this case comes from the social and political actors (and also journalists) that appear in the news stories.
In its most simplest form, framing can be positive or negative. If positive it would reduce the salience of an issue, like in Germany during the 1990s, where positive coverage about the integration of East Germany resulted in the decline of the integration as a problem among voters (M. McCombs, 2004; Schoenbach & Semetko, 1992). Jasperson et al. (1998) studied the public opinion from 1994 to 1996 regarding budget deficit as a problem and found that using both agenda setting and framing models together explained better opinion changes than by using each theory separately.
Framing can be applied to personal images as well as countries and issues. Some studies analyzed the agenda-setting-framing role and influence of professional public relations intervention concerning the image and portrayal of countries. Countries such as South Korea, Indonesia and others contracted professionals to have a better public image, the one that did not (Mexico) had worse performance (Manheim & Albritton, 1984).
Kim et al. (2002) analyzed the salience of six attributes related to the reasons in favor and against a new development of a commercial area in a city in Ithaca, USA, to show the high degree of correspondence between those who had more exposure to the local newspapers than to the ones with low exposure. This is a step beyond agenda setting; it is the setting of agenda attributes that occurred because mass media, newspapers in this case, defined the attributes, some in favor and some against the development plan, that modified or helped create the opinion of the public.
Maier et al. (2019) analyzed the framing of the news in a plagiarism scandal and developed the following table to assess in the content analysis process the attack and defense framing (table 2). The simple way to analyze framing (attack-defense) will be used in the longitudinal studies to have a more accurate description of the coverage about corruption (see chapter 9).
| Frame element | Attack frame | Defense frame |
|---|---|---|
| Problem definition | Violation of norms | No violation of norms |
| Public issue | Private issue | |
| Causal interpretation | Personal fault | External circumstances |
| Personality | Coincidence | |
| Full personal control | Out of personal control | |
| Moral evaluation | Condemnation from own camp | Support from own camp |
| Condemnation from opposition | Support from opposition | |
| Condemnation from other media | Support from other media | |
| Condemnation from citizens | Support from citizens | |
| Treatment recommendations | Support of: | Refusal of: |
| general/unspecific actions | General/unspecific actions | |
| resignation from office | Resignation from office | |
| personal punishment | Personal punishment | |
| defamation | Defamation | |
| A complete solving | A complete solving | |
| An apology | An apology | |
| constitution of committees | Constitution of committees | |
| structural actions | Structural actions |
Time lag
Multiple studies calculate the differences in the time it takes the salience of the news agenda to be transferred to the public agenda. Eaton (1989) reviewed the existing common theoretical explanations about how media effects take time to appear: the two-step process of communication “in which media influence opinion leaders, who in turn influence their followers” (p. 943) or the theory of diffusion, in which the adoption of the innovation follows a sigmoidal function, where time is in the horizontal axis and adoption in the vertical.
Different studies have produced inconsistent results for the optimal time lag for agenda-setting effects. To cite a few results: 2-6 months previous coverage before survey (M. E. McCombs, 1975); 4-6 weeks (Winter & Eyal, 1981); 0-2 weeks (Eaton, 1989); 1 week (Becker & McCombs, 1977). Note that these numbers are simplifications of more nuanced metrics that uses different databases and methodologies. Eaton (1989) notes that the differences between these findings in the literature, that spans from 4 months to weeks, seem more driven by the methodology of the analysis than by theory.
Other researchers have studied the different time-lag effects by media channel. Wanta and Hu (1994) analyzed time-lag effects for 5 different media types (TV, local TV, local newspapers, regional newspaper, and news magazine) in the USA and found that television had a shorter time-lag effect than newspapers.
Graphical representation
Most agenda-setting studies use tables to compare time series of news coverage and opinion surveys and correlation results. Only a few use data graphics to explore the data, usually with double or triple vertical axis timelines where news and opinion values are represented as lines connecting the data points.
Zucker (1978) compared graphically daily averaged news media attention and public opinion using a double axis for single issues (Fig. 42). For the unemployment issue, he added a third axis with the unemployment rate (Fig. 43) to compare with “real world” data:
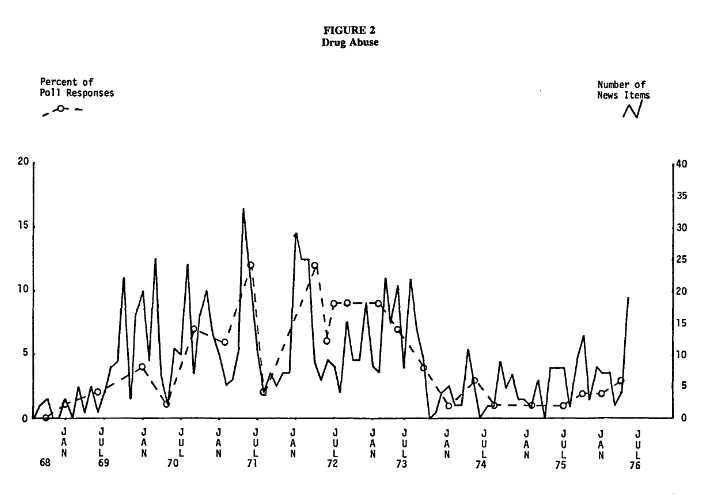
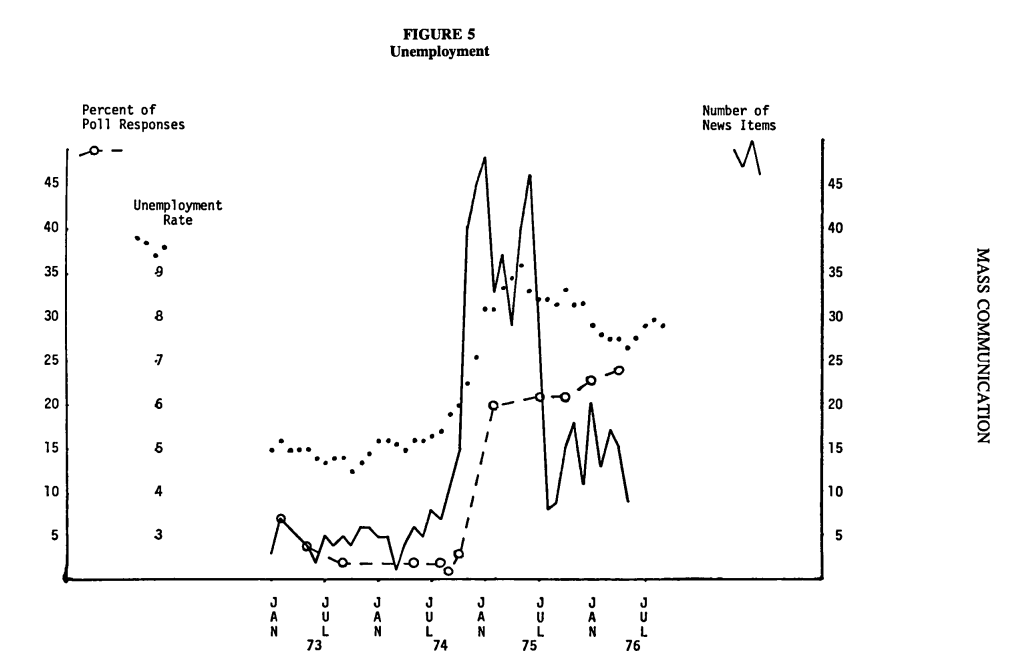
Double scales are suitable for comparing different scales but must be used with great care. Sometimes the axis scales are set arbitrarily and do not match, for example, the peaks of both curves. In others, the juxtaposition of curves of lines can suggest spurious relations if the analysis is centered on crossing the curves or other graphical artifacts. In Fig. 24, for example, the peak height of the three data series is very different (news > opinion > unemployment rate) and has been set arbitrarily.
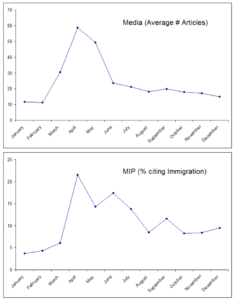
There are multiple examples of studies that use the raw number amount of monthly articles about a topic (without calculating relative coverage to the rest of the analyzed channel). Dunaway et al. (2010) analyzed the issue of immigration in the USin 2006, where they took into account public opinion, respondent ideology, gender as well as the location of the publication of newspapers (border-non border to the frontier in the USA). The data were represented in two different line charts, avoiding the use of double scales (Fig. 44).
Kirby (2021) studied environmental issues in the UK between 2006 and 2019 using the MII question (see Sec. 2.3.1 above) and media coverage22. She provided separated line charts for MII, the number of articles, politicians’ attention and the number of participants in protests aggregating the data by month. As shown in Fig. 45, Kirby mixes four timelines merged and normalized (standardized and aggregated at the annual level) in a single line chart: public agenda MIP; media attention in newspapers; politicians’ attention (members of parliament); protest participant-days23.
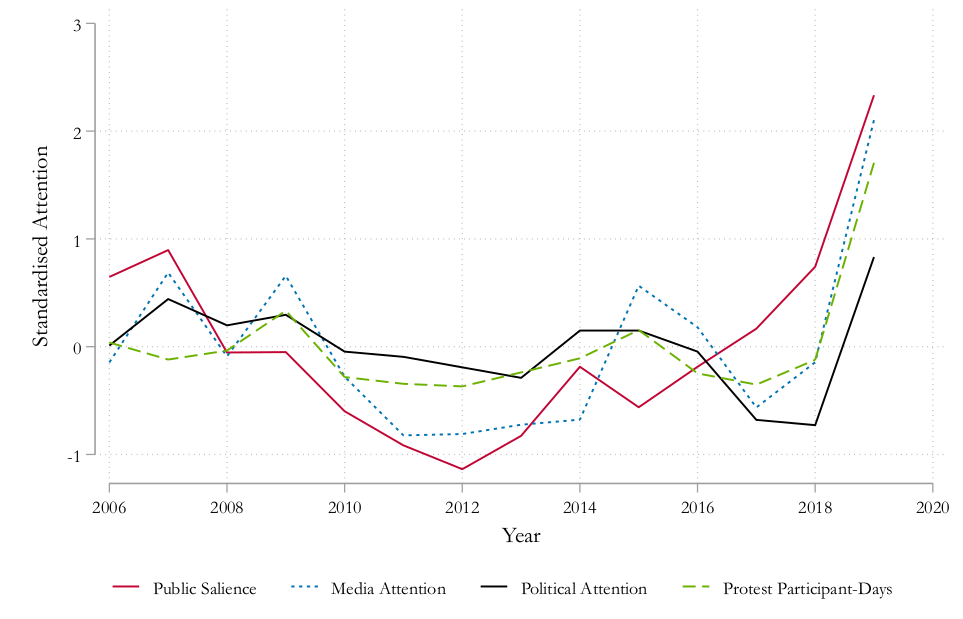
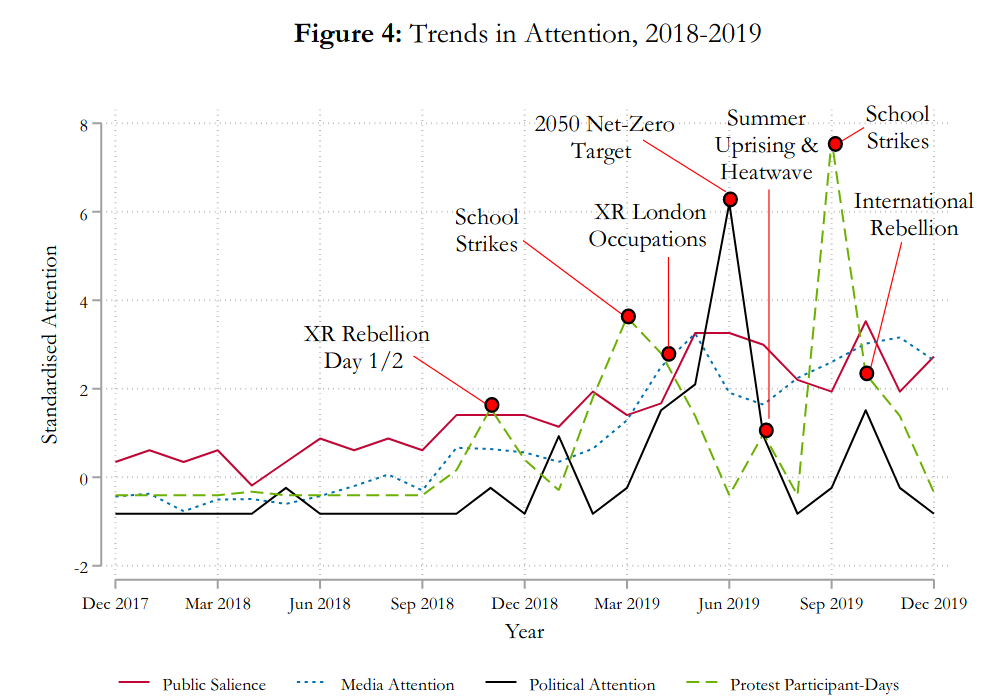
The use of normalized lines is beneficial for the comparative study of multiple data series (see Fig. 46); what must be clearly indicated is the aggregation times span and the normalized period used for the analysis. Another possibility is to use base 100 values for a particular date.
The availability of the data is also an issue when using line charts. For example, Smith (1980) tracked the trends of key issues according to the MIP question. Note that for the first years there is not much granularity in the data: the line that goes from 1952 to 1954 reveals that there few data points in that period, when compared to later periods (Fig. 47).


Theory gap and contributions
This brief review to various concepts related to agenda-setting studies (e.g. obtrusiveness, need for orientation, the novelty of topics, media exposure, control for reality, framing, and time lag) shows many of the variables that need to be taken in account to conduct agenda-setting analyses. These variables, together with more statistical related issues (e.g. news coverage window before survey, date of survey, correlation window, and correlation methodology) are explored in the longitudinal and in-depth studies to show the complexities of the agenda-setting process and the difficulties of its quantification and generalization. In part of the existing literature, these variables are not presented in an explicit way when the methodologies are introduced. For example, the type of linear correlation method (Pearson/Spearman) or the exact dates of the opinion surveys are many times left implicit. We try to fill these gaps and overcome these assumptions by explicitly addressing and studying the effect of these variables.
2.4.2 Intermedia agenda-setting
“It is the appearance on the front page of the Times that frequently legitimates a topic as newsworthy”. McCombs (2004), p. 113.
In the current online, interconnected, multi-channel, and media ecosystem, news outlets and social media influence one another’s agendas in the short-term. Intermedia agenda-setting’s framework serves to study how information flows between media channels.
News media outlets and channels
Intermedia agenda-setting occurs between news outlets and media channels. Vliegenthart (2008) explains that “intermedia agenda setting is the mechanism creating a common definition of what is news and what is not”, and can be observed when a news outlet copies another “medium’s decision to cover a news event and consider it to be newsworthy indirectly validates the first medium’s initial decision” (p. 860). The intermedia agenda-setting role of printed newspapers has already been covered above in section 2.1.1. Printed newspapers are not only big influencers. There are at the same time influenced by other agenda setters like politicians or other information services. For example, White (1950) and later Snider (1967) found that the story availability and categorization in a wire service shaped news story selection in small local Midwestern newspaper in the US, a finding later supported by McCombs & Shaw (1976).
The original agenda-setting study (M. McCombs & Shaw, 1972) showed a median correlation among issue agendas of five newspapers and two television networks of +0.81. A similar case study in Taipei (Taiwan) found a median correlation of +0.75 for three daily newspapers and three TV networks for the Taiwan legislative elections in 1992 (King, 1994). More recently, (Valenzuela & Arriagada, 2009) conducted another similar study in Chile, obtaining a median correlation of +0.83. News outlets influence each other strongly.
More recently, Vliegenthart and Walgrave (2008), in a longitudinal study, analyzed 8 years of TV and newspaper issues interrelations to show evidence that there was more short-term than long-term effects in the issues analyzed and that confirmed the stronger influence of newspaper outlets on TV News than the other way around. Vonbun et al. (2016, p. 3) evidenced that “the increased competition between media outlets during election campaigns will foster intermedia agenda-setting”, when they studied the most part of the media landscape of a country.
It seems that currently “this high degree of consistency in the media agenda is a worldwide phenomenon” (M. McCombs & Valenzuela, 2021, p. 131) and valid for different periods and media ecosystem in different countries.
At the personal level, journalists continuously observe what their peers publish not to miss important stories. Newsrooms routinely monitor other newspaper stories and it directly influences their choices (Ibid.). According to recent studies, there is an increase in the correlation between online news agendas during the day where “the median correlation between the agendas of the news websites CNN.com, Yahoo! News, MSNBC.com, Google News, and AOL News increased from an average of +0.21 in the mornings (9 a. m.) to +0.51 in the evenings (4pm)” (Ibid, p. 131). In the in depth case study about one corruption scandal (Sec. 10.6.2) I’ll study in intermedia setting effect within the day and obtain similar results.
This process is aligned with other studies that talk about the redundancy of the news agendas (Boczkowski, 2010). This issue is critical for the research design, where only a subset of the media ecosystem (some media channels and news outlets) can be analyzed.
News and social media dialogue
News and social media interaction can be studied within the framework of the intermedia agenda-setting theory too. Newsrooms pay attention to social media conversation to track the public’s interest. Before the introduction of the social networking sites, the academic literature studied the interrelations of the existing media channels. Before the hype of the networked social media, such as Facebook and Twitter, when blogs were an important alternative way of social communication online, Kelly (2008) studied whether the blogosphere and other web-native media were to replace mainstream media as primary sources of information: “the blogosphere is becoming as important as the front page of the paper for landing eyeballs on a journalist’s article. There is a cycle of attention between blogs and the MSM [Mainstream Media], in which the MSM uses the blogosphere (…), and the blogosphere channels attention back to the MSM” (Ibid., p.2). In the same way, more than a decade ago, scholars studied the complementary function of mainstream media and the blogosphere, media studies are focusing now on the rise of social media and the way it impacts the mainstream media (Newman, 2009, 2011).
The interaction between social networking sites and digital news media, with the introduction of new digital technologies, has interested communication scholars regarding how these new technologies have directly affected journalistic practices (Deuze, 2003, 2005; Lewis et al., 2010; Phillips, 2010; Phillips et al., 2009). Social media are analyzed in many studies as one more channels or channels where they make distinctions of the different type of users: journalists, politicians and citizens (Harder et al., 2017). For example, I compared visually the amount of Twitter messages and front page coverage about the occupy movement in the USA in 2011 (Fig. 29). Twitter conversation covering specific live events (grey peaks) preceded front pages coverage (red columns). In this sense, Twitter was advanced what the news were going to report.
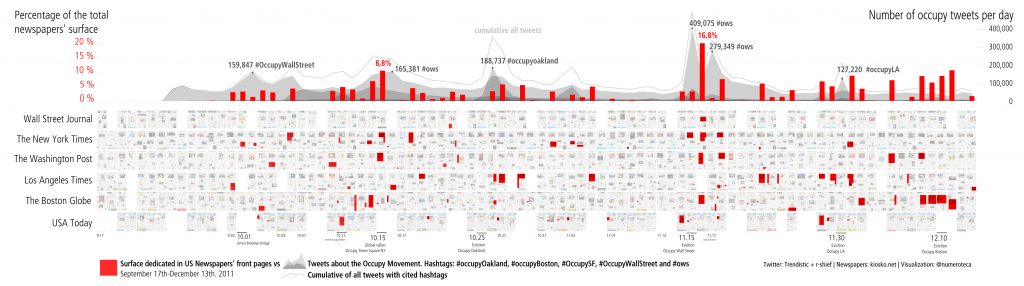
Twitter and Facebook were in origin networking communication tools where users were supposed to publish personal status updates. With time, users started sharing all types of information and rebroadcasting content from the web by sharing URL that linked to the original content. In 2009, Twitter exemplified this evolution when they changed the prominent question in their website “what are you doing?” for “what’s happening?”. Later, Twitter, as other social network platforms, enabled the embedding and publication of multimedia content (images, videos) and became “a central role in the way stories are sourced, broken and distributed” (Newman, 2011, p. 6). News media ended using and embedding social media content in their websites (e.g. embedding tweets or Instagram status).
Online news media, aware of the potential of these tools and the high Internet traffic that they command, have also engaged in the dissemination of their news stories through these new channels of communication. Furthermore, tools like Facebook Instant Articles24 allowed news media to publish their own articles natively on the Facebook platform. Twitter has enabled the possibility to publish live videos (Twitter live), in a similar fashion to Facebook Live application. Therefore, current analysis of social media necessarily includes news media outlets as they are also heavy users and actors of social networking sites. Both ecosystems can no longer be studied separately. There examples in the literature that use of multiple sources of online and off-line information across complex media ecosystems (Graeff et al., 2014).
Theory gap and contributions
In the in-depth case study (Sec. 10.5) I study how Twitter is influenced by news media at to which extent works as an extension of the news outlets.
Regarding its visualization, I have not found ad-hoc data visualizations for these intermedia agenda-setting analysis. In Sec. 10.6 I propose a series of graphics (timelines, coloured correlation matrices, and time based heatmaps) to enrich how agenda-setting is analyzed. Besides, a novel Sankey correlation diagram (Sec. 10.6.2) is proposed, that shows how the correlation between mass media items increases during the day. These data graphics expand the usual way statistical data and results are represented and are an example of the power of data graphics to obtain visual evidence.
2.4.3 The effect of memory decay
Watt et al. (1993) use the effect of memory decay to obtain a more accurate measure of the effective accumulated news coverage and public perception. They introduced a model of accumulated declining coverage effects, were they applied several general cognitive process, such as memory, attitudinal inertia, habituation, and selective attention. They assume that “receivers of a communication do not have perfect memory of all coverage to which they have been previously exposed, nor do they retain the effects of communications perfectly for some arbitrary period, then forget entirely” (p. 416). They suggest to use an exponential decay function that can describe the way memory decays, following existing cognitive research of memory (Woodworth & Schlosberg, 1954):

where P is retained amount of news coverage, the dependent variable at time t, M0 is the original amount of news coverage, e is the natural logarithm base and k the decay time constant. At the first moment of the analysis t = 0 so

, the retained coverage is the same as the accumulated coverage. As times passes, that memory fades away. For high k values the memory of the news coverage is rapidly forgotten, for a small k it takes more time to fade ways. A k = 0 would mean that there is no decline over time and that the influence of a particular news story never decays. If this equation is applied to all prior news coverage at a time point the idea of accumulated news coverage impact is nuanced by the declined effect of those stories. Continuing with Watt et al. (1993) the mathematical equation of this accumulated decline effect model is:
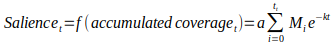
With the help of an exponential decay function it is possible to simulate, for different issues (Iran, inflation and Soviet Union), different levels of memory decay and find the ones that provide stronger results when the correlation with public opinion is calculated, looking for maximum effect. The issues, depending on their obtrusiveness and novelty followed different memory decay curves that adjusted better to public opinion opinion in a first level perspective III agenda setting analysis.
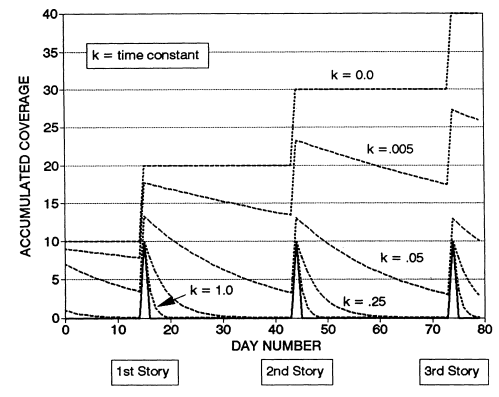
Theory gap and contributions
In section 9.4 this memory decay model is used for the corruption issue in front pages. It shows a great level of correspondence with the long term-term public concern about corruption. A basic visualization about this memory decay model can be seen in Fig. 49.
2.5 Summary of findings #
In this chapter I have reviewed the different historical and current approaches to measure news media. For the case of newspapers front pages, home pages of news sites and TV newscasts, it seems that it is possible to refine and improve the existing data gathering, content analysis and data visualization processes. New methodologies can benefit from automated processes and the use data graphics. In chapter 7. Research design: tools / instruments I present various tools I have specifically developed for each of these news media channels. In some cases these new methodologies involve new data gathering processes and building databases, in others automatization processes and innovative data visualization.
For newspaper front pages analysis, I have developed Pageonex to aid its coding, analysis, and visualization, that automates part of the process. For home page analysis I have developed another sister methodology, Homepagex, that tracks the position of headlines on news sites to build a picture of how news flows in home pages. The methodology involves web scraping the home pages hourly to build a database and an automated content analysis. For the last of the news channels, I have built a software, VerbaR, that explores a new database of TV newscast subtitles and visualizes when certain topics are mentioned.
All these methodologies use a series of underlying features that, while not strictly innovations, are not standard in communication studies and agenda-setting literature. For example, they propose the use of relative coverage and the prominence of each news item, instead of just the raw numbers (e. g. of news articles, sentences). All of them try to follow as close as possible how people receive the news. More on this contributions are explained in the 7.3 Methodological innovations.
The visual exploration of the data, that is capable of condensing thousands of data in a single graphic, is also a common feature in all these methodologies and through the entire dissertation. Very often in the literature, results are summarized by a single correlation value, for example, losing in the way, many details and nuances. I use data graphics at the same level of importance and relevance, sometimes even higher, as the numerical statistical results with which they are compared.
1“Most people are unable to accommodate their attention to the glass and transparency that is the work of art: instead, they pass through it without noticing and passionately wallow in the human reality that is alluded to in the work”.
2Jorge Luis Borges offers two examples of the access to “all” the knowledge: the 1:1 scale map of reality in “Del rigor de la ciencia” and the man that remembered everything in “Funes el memorioso”. Both stories address the impossibility of the human mind to document and process all the facts and details of reality.
3Though the original text, written in 1996, puts the focus on the absence of interaction between senders and receivers of information, which is broken with social media, where journalists have direct interaction with readers
4In the past, the creation of a new newspaper needed a heavy investment. In contrast, now the barrier is relatively lower in the digital sphere, where production and dissemination are not that costly compared to printed newspapers’ physical production and distribution.
5Except for a few metadata not available in the recording itself in the case of the video.
6Contrary to the general belief, everything is not archived.
7“As a special agent of mediatization, the front page offers the possibility of ‘freezing’ the very often long-lasting live coverage of the (ongoing) happenings. It does not stand in opposition to faster communication of news but the front page is a very special journalistic form that opens interesting ways to contemplate news temporalities on another level”, “the symbolic position of the front page continues to persist because of its highly specific temporal status – at least as long as the printed press will continue to exist” -The front page as a time freezer: An analysis of the international newspaper coverage after the Charlie Hebdo attacks – (Niemeyer, 2019).
8Paraphrased from “Even as the media ecosystem has been rapidly transformed by the continued globalization of the cultural industries (Hesmondhalgh, 2002), the spread of broadband internet and mobile phones, the rise in read/write digital media literacies (Anderson et al., 2011), and the steady growth of social media, daily print newspapers continue to be a key mechanism for organizing both public and elite attention”.
9News editors “could and did select and develop stories with themes congruent with newspaper policy, but their elaboration procedure disguised the importance of ideology. That is, the content-free nature of ‘elaborating more’ allowed editors to select stories that fit with their ideological preferences without acknowledging the importance of theme in their original decision to elaborate a particular story” (Reisner, 1992).
10Website is not active anymore: policyagendas.org. It is available on the Internet’s Archive: https://web.archive.org/web/20150316084437/http://policyagendas.org/
11In the interviews I made for this research, this is the case for El Mundo, for example.
12There are exceptions to this rule. Newspapers like El Mundo, El País, or ABC can have a front page version for the Madrid edition and others for the regions.
13According to the interview with El País editor (2021), around 70% of visits in the afternoon come from mobile devices.
14El Mundo shows “another” front page when the user scrolls down: new sections are displayed after the main home page: sports, Spain, Economy, International, Madrid, LOC, Culture, etc.; in fact the URL changes when the user scrolls down: from https://www.elmundo.es to https://www.elmundo.es/deportes.html
15According to their openness, it is possible to classify as: (a) open: Twitter, Instagram, TikTok, Youtube, Weibo; (b) 50/50: Facebook; (c) closed: Whatsapp, Signal, Path, Telegram.
16For any app rate limit (OAuth 2.0 App Access Token).
17Google Search has become the leading search engine, with 95% of the market share in Spain, according to Statcounter. Accessed: 2022-07-14 https://gs.statcounter.com/search-engine-market-share/all/spain
18Besides Google Trends, Google offered other related search data like the Google Health API , that showed results as the proportion of all the searches produced in a region-country and period. This service is likely deprecated or at least not publicly available.
19“The mythic hypodermic needle theory of media effects viewed media influence as essentially immediate (…), media messages were injected into the audience much as medical injections are administered to patients and typically achieve rather quick effects” (M. McCombs & Valenzuela, 2021, p. 103).
20Brosius and Kepplinger (1992) propose 4 non linear models: Threshold, Acceleration, Inertia and Echo that are interesting for the present research. It is likely that the agenda-setting effect of corruption stories is a mix of the four.
21“Integrity” was based on the definition of a candidate as ‘corrupt’ or ‘not corrupt’. “This last attribute was noted in the descriptions of the candidates in order to capture a major issue in the national election, corruption in the government and the related controversy over whether the incumbent prime minister, González, was personally involved in the corruption” (M. McCombs & Valenzuela, 2021, p. 47).The correlation is quite strong from the different medium analyzed: 2 TV news services, 2 local newspapers, 2 national newspapers. They analyze each assertion/sentence.
22She uses Granger causality test to analyze possible causal effects among timelines.
23What is difficult to understand in these charts are the negative attention values.
24Facebook Instant Articles was launched on May 2015.
Bilbiography of this chapter #
Abbruzzese, J. (2014, May 16). The Full New York Times Innovation Report. Mashable. https://mashable.com/archive/full-new-york-times-innovation-report
AIMC, A. para la I. de medios de comunicación. (2021). Marco General de los medios en España 2021. https://www.aimc.es/a1mc-c0nt3nt/uploads/2021/02/marco2021.pdf
Althaus, S. L., Edy, J. A., & Phalen, P. F. (2002). Using the Vanderbilt Television Abstracts to Track Broadcast News Content: Possibilities and Pitfalls. Journal of Broadcasting & Electronic Media, 46(3), 473–492. https://doi.org/10.1207/s15506878jobem4603_9
Álvarez-Peralta, M. (2011). Popularization of the Scientific Knowledge about the Economic Crisis in the Spanish Mass Media: Trends, Inaccuracies and Omissions in the Documentation Process of Press Discourse on Economics. 2(3).
Álvarez-Peralta, M. (2015). La crisis en portada: Representaciones de la crisis económica en la prensa española de referencia (2008-2012) [Info:eu-repo/semantics/doctoralThesis, Universidad Complutense de Madrid]. https://eprints.ucm.es/id/eprint/34411/
Anderson, C. W., Glaisyer, T., Smith, J., & Rothfeld, M. (2011). Shaping 21st century journalism. Leveraging a Teaching Hospital Model in journalism education. New America Foundation. https://knightfoundation.org/wp-content/uploads/2011/10/Shaping_21st_Century_Journalism-2.pdf
Ares, M., & Hernández, E. (2017). The corrosive effect of corruption on trust in politicians: Evidence from a natural experiment. Research & Politics, 4(2), 2053168017714185. https://doi.org/10.1177/2053168017714185
Arévalo Salinas, A. I., Al Najjar Trujillo, T., & Aidar Abib, T. (2021). La cobertura informativa de la inmigración en Televisión Española. El caso del barco Aquarius. Estudios sobre el mensaje periodístico, 27, 13–25.
Becker, L. B., & McCombs, M. E. (1977). U.S. Primary Politics and Public Opinion: The Role of the Press in Determining Voter Reactions.
Benton, J. (2014). The leaked New York Times innovation report is one of the key documents of this media age. Nieman Lab. https://www.niemanlab.org/2014/05/the-leaked-new-york-times-innovation-report-is-one-of-the-key-documents-of-this-media-age/
boyd, danah m., & Ellison, N. B. (2007). Social Network Sites: Definition, History, and Scholarship. Journal of Computer-Mediated Communication, 13(1), 210–230. https://doi.org/10.1111/j.1083-6101.2007.00393.x
Boydstun, A. (2006). Agenda-setting and issue-framing dynamics in front-page news. In annual meeting of the American Political Science Association. https://myweb.uiowa.edu/bhlai/workshop/boydstun.pdf
Boyle, T. P. (2001). Intermedia Agenda Setting in the 1996 Presidential Election. Journalism & Mass Communication Quarterly, 78(1), 26–44. https://doi.org/10.1177/107769900107800103
Breed, W. (1955). Newspaper ‘Opinion Leaders’ and Processes of Standardization. Journalism Quarterly, 32(3), 277–328. https://doi.org/10.1177/107769905503200302
Broder, D. S. (2000). Behind the Front Page. Simon and Schuster.
Brosius, H., & Kepplinger, H. M. (1992). Linear and nonlinear models of agenda‐setting in television. Journal of Broadcasting & Electronic Media, 36(1), 5–23. https://doi.org/10.1080/08838159209364151
Bruns, A., & Burgess, J. (2011a). New methodologies for researching news discussion on Twitter. In A. Phillips (Ed.), Proceedings of the 3rd Future of Journalism Conference 2011 (pp. 1–11). Cardiff University. http://www.cf.ac.uk/jomec/conference/futureofjournalism/index.html
Bruns, A., & Burgess, J. (2011b). The use of Twitter hashtags in the formation of ad hoc publics. In A. Bruns & P. De Wilde (Eds.), Proceedings of the 6th European Consortium for Political Research (ECPR) General Conference 2011 (pp. 1–9). The European Consortium for Political Research (ECPR). https://eprints.qut.edu.au/46515/
Bruns, A., & Burgess, J. (2012). Notes towards the scientific study of public communication on Twitter. In A. Tokar, M. Mahrt, I. Peters, K. Weller, S. Keuneke, M. Beurskens, C. Puschmann, & T. van Treeck (Eds.), Science and the internet (pp. 159–169). Duesseldorf University Press. http://www.uni-duesseldorf.de/home/fileadmin/redaktion/DUP/PDF-Dateien_/Open_Access/Science_and_the_Internet_OA.pdf
Bruns, A., & Stieglitz, S. (2014). Twitter data: What do they represent? It – Information Technology, 56(5), 240–245. https://doi.org/10.1515/itit-2014-1049
Cardenal, A. S., Galais, C., & Majó-Vázquez, S. (2019). Is Facebook Eroding the Public Agenda? Evidence From Survey and Web-Tracking Data. International Journal of Public Opinion Research, 31(4), 589–608. https://doi.org/10.1093/ijpor/edy025
Caro Cabrera, M. J., & Navarro Ardoy, L. (2017). La medición del miedo al delito a través de los barómetros del CIS. https://idus.us.es/handle/11441/65964
Chaqués-Bonafont, L., Palau, A. M., & Baumgartner, F. R. (2015). Agenda Dynamics in Spain. London, Palgrave.
Coche, R. (2015). The Amount of Women’s Sports Coverage on International Sports News Websites’ Home Pages: Content Analysis of the Top Two Sites From Canada, France, Great Britain, and the United States. Electronic News, 9(4), 223–241. https://doi.org/10.1177/1931243115604882
Cohen, B. C. (1963). Press and foreign policy. Princeton University Press.
Congosto Martínez, M. L. (2016). Caracterización de usuarios y propagación de mensajes en Twitter en el entorno de temas sociales. https://e-archivo.uc3m.es/handle/10016/22826
Costanza-Chock, S., & Rey-Mazón, P. (2016). PageOneX: New Approaches to Newspaper Front Page Analysis. International Journal of Communication, 10(0), Article 0.
Danielian, L. H., & Reese, S. D. (2012). A closer look at intermedia influences on agenda setting: The cocaine issue of 1986. In P. J. Shoemaker (Ed.), Communication campaigns about drugs: Government, media, and the public (pp. 47–66). Routledge.
Deuze, M. (2003). The Web and its Journalisms: Considering the Consequences of Different Types of Newsmedia Online. New Media & Society, 5(2), 203–230. https://doi.org/10.1177/1461444803005002004
Deuze, M. (2005). What is journalism?: Professional identity and ideology of journalists reconsidered. Journalism, 6(4), 442–464. https://doi.org/10.1177/1464884905056815
Deuze, M. (2008). The Changing Context of News Work: Liquid Journalism for a Monitorial Citizenry. International Journal of Communication, 2(0), Article 0.
Di Tella, R., & Franceschelli, I. (2011). Government Advertising and Media Coverage of Corruption Scandals. American Economic Journal: Applied Economics, 3(4), 119–151.
D’Ignazio, C., & Klein, L. F. (2020). Data feminism. The MIT Press.
Driscoll, K., & Walker, S. (2014). Big Data, Big Questions| Working Within a Black Box: Transparency in the Collection and Production of Big Twitter Data. International Journal of Communication, 8(0), Article 0.
Dunaway, J., Branton, R. P., & Abrajano, M. A. (2010). Agenda Setting, Public Opinion, and the Issue of Immigration Reform. Social Science Quarterly, 91(2), 359–378. https://doi.org/10.1111/j.1540-6237.2010.00697.x
Eaton, H. (1989). Agenda-Setting with Bi-Weekly Data on Content of Three National Media. Journalism Quarterly, 66(4), 942–959. https://doi.org/10.1177/107769908906600427
Eyal, C. H. (1980). Time Frame in Agenda-Setting Research: A Study of the Conceptual and Methodological Factors Affecting the Time Frame Context of the Agenda-Setting Process. Unpublished doctoral dissertaton, Syracuse University.
Eyal, C. H., Winter, J. P., & Rogers, A. H. (1982). Issue-specific agenda-setting: The whole as less than the sum of the parts. Canadian Journal of Communication, 8.2.
Ferree, M. M., Gamson, W. A., Gerhards, J., & Rucht, D. (2002). Shaping Abortion Discourse: Democracy and the Public Sphere in Germany and the United States. Cambridge University Press. https://doi.org/10.1017/CBO9780511613685
Forrest, W. (1934). Behind the front page: Stories of newspaper stories in the making. D. Appleton-Century Company.
Fundación Ciudadana Civio. (2022). Verba. https://github.com/civio/verba
Funkhouser, G. R. (1973). The issues of the sixties: An exploratory study in the dynamics of public opinion. Public Opinion Quarterly, 37(1), 62–75. https://doi.org/10.1086/268060
Gans, H. J. (1979). Deciding what’s news: A study of CBS evening news, NBC nightly news, Newsweek, and Time (1st ed.). Pantheon Books.
Gerd G. Kopper, Kolthoff, A., & Czepek, A. (2000). Research Review: Online Journalism – a report on current and continuing research and major questions in the international discussion. Journalism Studies, 1(3), 499–512. https://doi.org/10.1080/14616700050081803
Germain Lee, B. C., Ortiz Baco, J., Salter, S. H., & Casey, J. (2021). Navigating the Mise-en-Page: Interpretive Machine Learning Approaches to the Visual Layouts of Multi-Ethnic Periodicals. In ArXiv e-prints. https://ui.adsabs.harvard.edu/abs/2021arXiv210901732G
Golan, G. (2006). Inter-Media Agenda Setting and Global News Coverage. Journalism Studies, 7(2), 323–333. https://doi.org/10.1080/14616700500533643
González-Bailón, S., Borge-Holthoefer, J., & Moreno, Y. (2013). Broadcasters and Hidden Influentials in Online Protest Diffusion. American Behavioral Scientist, 57(7), 943–965. https://doi.org/10.1177/0002764213479371
González-Bailón, S., Wang, N., Rivero, A., Borge-Holthoefer, J., & Moreno, Y. (2012). Assessing the Bias in Communication Networks Sampled from Twitter. ArXiv:1212.1684 [Physics]. http://arxiv.org/abs/1212.1684
Graeff, E., Stempeck, M., & Zuckerman, E. (2014). The Battle for ‘Trayvon Martin’: Mapping a Media Controversy Online and Offline. https://dspace.mit.edu/handle/1721.1/123459
Granka, L. A. (2010). Measuring Agenda Setting with Online Search Traffic: Influences of Online and Traditional Media (SSRN Scholarly Paper ID 1658172). Social Science Research Network. https://papers.ssrn.com/abstract=1658172
Gross, K., & Aday, S. (2003). The Scary World in Your Living Room and Neighborhood: Using Local Broadcast News, Neighborhood Crime Rates, and Personal Experience to Test Agenda Setting and Cultivation. Journal of Communication, 53(3), 411–426. https://doi.org/10.1111/j.1460-2466.2003.tb02599.x
Harder, R. A., Sevenans, J., & Van Aelst, P. (2017). Intermedia Agenda Setting in the Social Media Age: How Traditional Players Dominate the News Agenda in Election Times. The International Journal of Press/Politics, 22(3), 275–293. https://doi.org/10.1177/1940161217704969
Herman, E. S., & Chomsky, N. (1988). Manufacturing consent: The political economy of the mass media (1st ed). Pantheon Books.
Hester, J. B., & Gibson, R. (2003). The Economy and Second-Level Agenda Setting: A Time-Series Analysis of Economic News and Public Opinion about the Economy. Journalism & Mass Communication Quarterly, 80(1), 73–90. https://doi.org/10.1177/107769900308000106
Howison, J., Wiggins, A., & Crowston, K. (2011). Validity Issues in the Use of Social Network Analysis with Digital Trace Data. Journal of the Association for Information Systems, 12(12). https://doi.org/10.17705/1jais.00282
Iyengar, S., & Simon, A. (1993). News Coverage of the Gulf Crisis and Public Opinion: A Study of Agenda-Setting, Priming, and Framing. Communication Research, 20(3), 365–383. https://doi.org/10.1177/009365093020003002
Jasperson, A. E., Shah, D. V., Watts, M., Faber, R. J., & Fan, D. P. (1998). Framing and the Public Agenda: Media Effects on the Importance of the Federal Budget Deficit. Political Communication, 15(2), 205–224. https://doi.org/10.1080/10584609809342366
Jennings, W., & Wlezien, C. (2011). Distinguishing Between Most Important Problems and Issues? Public Opinion Quarterly, 75(3), 545–555. https://doi.org/10.1093/poq/nfr025
Karlsson, M., & Strömbäck, J. (2010). Freezing the Flow of Online News. Journalism Studies, 11(1), 2–19. https://doi.org/10.1080/14616700903119784
Kelly, J. (2008). Pride of Place: Mainstream Media and the Networked Public Sphere. https://ictlogy.net/bibliography/reports/projects.php?idp=1327&lang=es
Kepplinger, H. M., & Roth, H. (1979). Creating a Crisis:German Mass Media and Oil Supply in 1973-74. Public Opinion Quarterly, 43(3), 285–296. https://doi.org/10.1086/268522
Kim, S.-H., Scheufele, D. A., & Shanahan, J. (2002). Think about it This Way: Attribute Agenda-Setting Function of the Press and the public’s Evaluation of a Local Issue. Journalism & Mass Communication Quarterly, 79(1), 7–25. https://doi.org/10.1177/107769900207900102
Kim, Y. S., & Chung, D. S. (2017). Anatomy of Front Pages: Comparison between The New York Times and other U.S. Major Metropolitan Newspapers. International Journal of Communication, 11(0), Article 0.
King, P. (1994). Issue agendas in the 1992 Taiwan legislative election—ProQuest. University of Texas at Austin. https://www.proquest.com/openview/f80bcf0d91fcb56dd925bf5ebd58c484/1?pq-origsite=gscholar&cbl=18750&diss=y
Kiousis, S., Bantimaroudis, P., & Ban, H. (1999). Candidate Image Attributes: Experiments on the Substantive Dimension of Second Level Agenda Setting. Communication Research, 26(4), 414–428. https://doi.org/10.1177/009365099026004003
Kirby, M. (2021). Modelling the Fall and Rise in the Importance of the Environment to the British Public: 2006-2019 (SSRN Scholarly Paper ID 3893575). Social Science Research Network. https://doi.org/10.2139/ssrn.3893575
Kirkland, S. (2014, May 19). 3 takeaways from the “death of the homepage” and The New York Times innovation report. Poynter. https://www.poynter.org/reporting-editing/2014/3-takeaways-from-the-death-of-the-homepage-and-the-new-york-times-innovation-report/
Klein, E. (2014, May 15). The home page isn’t dead. It’s just resting. Vox. https://www.vox.com/2014/5/15/5721288/the-home-page-isnt-dead-its-just-resting
Kwak, H., Lee, C., Park, H., & Moon, S. (2010). What is Twitter, a social network or a news media? Proceedings of the 19th International Conference on World Wide Web, 591–600. https://doi.org/10.1145/1772690.1772751
Lazarsfeld, P. F. (1944). The Election Is Over. The Public Opinion Quarterly, 8(3), 317–330.
Lewis, S. C., Kaufhold, K., & Lasorsa, D. L. (2010). Thinking About Citizen Journalism. Journalism Practice, 4(2), 163–179. https://doi.org/10.1080/14616700903156919
Li, X. (2013). Internet Newspapers: The Making of a Mainstream Medium. Routledge.
Lin, C. A., & Atkin, D. J. (Eds.). (2014). Communication Technology and Social Change: Theory and Implications. Routledge.
Lippmann, W. (1922). Public opinion. Harcourt, Brace and Company. http://xroads.virginia.edu/~Hyper/Lippman/contents.html
López-Escobar, E. (Esteban), Llamas, J. P. (Juan P., & McCombs, M. (Maxwell). (1996). Una dimensión social de los efectos de los medios de difusión: Agenda-setting y consenso. https://dadun.unav.edu/handle/10171/8620
Luhmann, Niklas. (2000). The reality of the mass media. Stanford University Press.
Maier, J., Jansen, C., & Sikorski, C. von. (2019). Media framing of political scandals. Routledge Handbooks Online. https://doi.org/10.4324/9781351173001-11
Manheim, J. B., & Albritton, R. B. (1984). Changing National Images: International Public Relations and Media Agenda Setting. The American Political Science Review, 78(3), 641–657. https://doi.org/10.2307/1961834
Matsa, K. E., Mitchell, A., & Stocking, G. (2017, April 27). Searching for News: The Flint water crisis. Pew Research Center’s Journalism Project. https://www.pewresearch.org/journalism/2017/04/27/searching-for-news-the-flint-water-crisis/
Matsa, K. E., & Stocking, G. (2017, April 27). Using Google Trends data for research? Here are 6 questions to ask. Medium. https://medium.com/@pewresearch/using-google-trends-data-for-research-here-are-6-questions-to-ask-a7097f5fb526
McCombs, M. (2004). Setting the agenda: The mass media and public opinion. Cambridge, UK : Polity ; Malden, MA : Blackwell Pub. http://archive.org/details/settingagendamas0000mcco
McCombs, M. E. (1975). Measuring the Cumulative Agenda-Setting Influence of the Mass Media. https://eric.ed.gov/?id=ED120797
McCombs, M., Lopez-Escobar, E., & Llamas, J. P. (2000). Setting the Agenda of Attributes in the 1996 Spanish General Election. Journal of Communication, 50(2), 77–92. https://doi.org/10.1111/j.1460-2466.2000.tb02842.x
McCombs, M., & Shaw, D. L. (1972). The agenda-setting function of mass media. Public Opinion Quarterly, 36(2), 176–187. https://doi.org/10.1086/267990
McCombs, M., & Shaw, D. L. (1976). Structuring the “Unseen Environment.” Journal of Communication, 26(2), 18–22. https://doi.org/10.1111/j.1460-2466.1976.tb01374.x
McCombs, M., & Valenzuela, S. (2021). Setting the agenda: The mass media and public opinion (3rd ed.). Cambridge, UK : Medford, MA: Polity Press, 2020.
McLeod, J. M., Becker, L. B., & Byrnes, J. E. (1974). Another Look At the Agenda-Setting Function of the Press. Communication Research, 1(2), 131–166. https://doi.org/10.1177/009365027400100201
Mellon, J. (2014). Internet search data and issue salience: The properties of Google Trends as a measure of issue salience. Journal of Elections, Public Opinion and Parties, 24(1), 45–72. https://doi.org/10.1080/17457289.2013.846346
Nahon, K., Hemsley, J., Mason, R. M., Walker, S., & Eckert, J. (2013). Information flows in events of political unrest. https://doi.org/10.9776/13259
Negroponte, N. (1996). Being digital (1st Vintage Books ed). Vintage Books.
Newman, N. (2009). The rise of social media and its impact on mainstream journalism. https://ora.ox.ac.uk/objects/uuid:a980df14-1b49-401b-a136-78d47ab76cdc
Newman, N. (2011). Mainstream media and the distribution of news in the age of social media. https://ora.ox.ac.uk/objects/uuid:94164da6-9150-4938-8996-badfdef6b507
Niemeyer, K. (2019). The front page as a time freezer: An analysis of the international newspaper coverage after the Charlie Hebdo attacks. Media, War & Conflict, 12(2), 187–201. https://doi.org/10.1177/1750635219839378
Ortega y Gasset, J. (1925). La deshumanización del arte.
Pelat, C., Turbelin, C., Bar-Hen, A., Flahault, A., & Valleron, A.-J. (2009). More Diseases Tracked by Using Google Trends. Emerging Infectious Diseases, 15(8), 1327–1328. https://doi.org/10.3201/eid1508.090299
Phillips, A. (2010). Transparency and the New Ethics of Journalism. Journalism Practice, 4(3), 373–382. https://doi.org/10.1080/17512781003642972
Phillips, A., Singer, J. B., Vlad, T., & Becker, L. B. (2009). Implications of Technological Change For Journalists’ Tasks and Skills. Journal of Media Business Studies, 6(1), 61–85. https://doi.org/10.1080/16522354.2009.11073479
Reisner, A. E. (1992). The News Conference: How Daily Newspaper Editors Construct the Front Page. Journalism Quarterly, 69(4), 971–986. https://doi.org/10.1177/107769909206900416
Rogstad, I. (2016). Is Twitter just rehashing? Intermedia agenda setting between Twitter and mainstream media. Journal of Information Technology & Politics, 13(2), 142–158. https://doi.org/10.1080/19331681.2016.1160263
Rosenberg, H., & Feldman, C. S. (2008). No Time To Think: The Menace of Media Speed and the 24-hour News Cycle. A&C Black.
Salaverría-Aliaga, R., & Sancho, F. (2007). Del papel a la web: Evolución y claves del diseño periodístico en internet. Diseño periodístico en Internet, 2007, ISBN 978-84-8373-998-3, págs. 207-239, 207–239. https://dialnet.unirioja.es/servlet/articulo?codigo=2531063
Saldaña, M., & Ardèvol-Abreu, A. (2016). From compelling arguments to compelling associations at teh third level of agenda setting. In The Power of Information Networks: New Directions for Agenda Setting (pp. 104–118). Routledge.
Schoenbach, K., & Semetko, H. A. (1992). Agenda-Setting, Agenda-Reinforcing or Agenda-Deflating? A Study of the 1990 German National Election. Journalism Quarterly, 69(4), 837–846. https://doi.org/10.1177/107769909206900404
Shirky, C. (2008). Here comes everybody: The power of organizing without organizations. Penguin Press.
Singer, J. B. (2003). Who are these Guys?: The Online Challenge to the Notion of Journalistic Professionalism. Journalism, 4(2), 139–163. https://doi.org/10.1177/146488490342001
Smith, T. W. (1980). America’s Most Important Problem—A Trend Analysis, 1946–1976. Public Opinion Quarterly, 44(2), 164–180. https://doi.org/10.1086/268582
Smith, T. W. (1985). The Polls: America’s Most Important Problems Part I: National and International. Public Opinion Quarterly, 49(2), 264–274. https://doi.org/10.1086/268922
Snider, P. B. (1967). “Mr. Gates” Revisited: A 1966 Version of the 1949 Case Study. Journalism Quarterly, 44(3), 419–427. https://doi.org/10.1177/107769906704400301
Sumpter, R. S. (2000). Daily newspaper editors’ audience construction routines: A case study. Critical Studies in Media Communication, 17(3), 334–346. https://doi.org/10.1080/15295030009388399
Sunstein, C. R. (2001). Republic.com. Princeton University Press.
Takeshita, T. (1993). Agenda-setting effects of the press in a Japanese local election. Studies of Broadcasting, 29.
Twitter. (2022). API reference: GET /2/tweets/search/all. https://developer.twitter.com/en/docs/twitter-api/tweets/search/api-reference/get-tweets-search-all
Valenzuela, S., & Arriagada, A. (2009). Competencia por la uniformidad en noticieros y diarios chilenos 2000-2005. Cuadernos.info, 24, Article 24. https://doi.org/10.7764/cdi.24.33
Vliegenthart, R., & Walgrave, S. (2008). The Contingency of Intermedia Agenda Setting: A Longitudinal Study in Belgium. Journalism & Mass Communication Quarterly, 85(4), 860–877. https://doi.org/10.1177/107769900808500409
Vonbun, R., Königslöw, K. K., & Schoenbach, K. (2016). Intermedia agenda-setting in a multimedia news environment. Journalism, 17(8), 1054–1073. https://doi.org/10.1177/1464884915595475
Walker, S., Hemsley, J., Eckert, J., Mason, R. M., & Nahon, K. (2013). Some tools for social media research. https://doi.org/10.9776/13496
Wanta, W., & Hu, Y.-W. (1994). Time-lag differences in the agenda-setting process: An examination of five news media. International Journal of Public Opinion Research, 6(3), 225–240. https://doi.org/10.1093/ijpor/6.3.225