5.1 Objectives and hypothesis #
The main research objectives of the present dissertation are (1) to explore the potential of innovative data gathering techniques, content analysis, and data visualization; (2) to compare these new techniques to those described in the literature; and (3) to contribute to the theories about the agenda-setting role of news and social media on the public agenda in the current online-mobile-social-multichannel media ecosystem.
A goal that permeates the whole research is to demonstrate how visual evidence is a powerful tool, at the same level as statistical analysis, to provide insights and extract conclusions from the results.
From a more general perspective, this work aims to understand how the current mass media ecosystem works regarding intermedia relationships between news and social media channels. The key contributions are:
- At the theoretical and methodological level, an exploration of the potential of data visualization methodologies to review existing theories and methodologies that study the agenda-setting role of news and social media in public opinion.
- At the empirical level, to determine if (and how) the news coverage of corruption influences or modifies public opinion, to clarify how persuasive the mass media ecosystem is.
- At the instrumental level, to develop new data collection, analysis, and visualization tools that help analyze in innovative ways the current media ecosystem, with a strong focus on obtaining visual evidence and capturing data as close as possible to the user experience.
- At the ethical level, to make data collection, analysis, and visualization tools open and available. In summary, what science should have always been to make open science.
In this chapter, I lay out the hypothesis to carry out empirical research studies of intermedia agenda-setting between the different parts/channels of the mass media ecosystem channels to update previous findings about the optimal time lag to observe the appearance of agenda-setting effects. In the empirical studies, daily, hourly and by-the-minute data aggregations are used to compare coverage in news and social media channels –printed newspapers, online news sites, television newscasts, and Twitter–, thereby obtaining accurate and nuanced metrics. Additionally, the research also considers the question if, and to which extent, Twitter has replaced mainstream media in the gatekeeping role for news spreading that was traditionally controlled by them.
The working hypothesis can be summarized as follows:
- H1. News media have a strong agenda-setting effect on the public agenda for corruption-related stories.
- H2. The influence of the mass media ecosystem on public opinion is effective in the short term, i.e., in the scale of days.
- H3. Social media do not have a relevant or decisive influence on the configuration of the public agenda, traditionally set by the news media.
5.2 Research questions #
In order to test these hypotheses research, questions have been grouped into two: the ones that deal with the methodology and how to measure possible agenda-setting effects (explored in the longitudinal studies) and ones that study the multi-channel media ecosystem (explored in the in-depth case study about a corruption scandal).
5.2.1 Research questions on methodology and agenda setting
RQ1: How long does it take for mass media attention to an issue to translate into a significant change in public opinion?Years, months, weeks, days,or never?
According to the literature and preliminary analysis, I hypothesize is that a 1-2 weeks period (shorter than many articles in the literature) will have a stronger correlation with public opinion, given the current speed and synchronicity of the current media ecosystem, which is strongly based on online media.
To answer this question, we will employ various visual and statistical comparisons of different time lags, using different windows of news coverage before the survey date for various news and public agendas issues. We will also use other metrics beyond the number of news stories or space devoted to an issue that potentially modulates its agenda-setting effect (memory decay, novelty, fragmentation, co-occurrence).
RQ2: Which methodologies and metrics describe with more accuracy the current mass media ecosystem and its agenda-setting effect on the public agenda?
I hypothesize that a more nuanced data gathering methodology, one that considers the relative space dedicated to a topic (percentage of surface area, ranking of news), will provide stronger results in agenda setting correlation (media → public opinion) as it takes in account prominence of news selection, it is closer to user experience.
To study this, I compare different content analysis methodologies to measure news stories about corruption on front pages (existing databases that use the relative number of news stories; and new developed databases that use the percentage of surface area): timelines of news and public opinion with different rolling average windows; the correlation between timelines, correlation with public opinion in years long study; correlations with different weeks of news coverage before the survey.
RQ3: Do different news media coverage produce different results in public opinion about corruption in Catalonia and Madrid regions?
Differentiated news coverage in various regions can provide quasi-experimental situations that can be used to study different effects on public opinion. The hypothesis is that public opinion in Catalonia will be more influenced by Catalan newspapers (it will correlate more strongly). To test this, we compare –statistically and visually– news coverage about corruption in Catalan and non-Catalan newspapers and the public concern about corruption.
5.2.2 Research questions related to intermedia agenda-setting and Twitter
Social networking sites can potentially change the almost exclusive gatekeeping role of the mainstream media. Through Twitter, people can participate in the otherwise exclusive mass media arena. However, there are signs of the limited impact of Twitter on the public agenda and in the strong effect of news both in people’s opinion and in Twitter conversation. The following questions try to investigate the intermedia agenda-setting effect of different news channels and Twitter and how they influence each other.
RQ4: How are social networking sites changing the agenda-setting role of traditional mainstream media in the issue of corruption?
Our initial hypothesis (H3) is that social media do not strongly influence how the news media sets the agenda. We use the in-depth case study, the detailed analysis of a corruption scandal (chapter 10), to measure the Twitter conversation about a scandal (number of tweets, participation of news media and journalists, relative number of tweets by news media) and compare it to other news channels (front pages, home pages, TV newscasts) and public opinion (Google Search and CIS). We also analyze Twitter RT networks to see the main players with centrality measures (journalists, news media, politicians…). The analysis of the most shared URLs included in the tweets (and who shares them) will provide insight into the type of shared content. For that purpose, I have classified hundreds of web domains to find which proportion of the tweets link to news sites. We also list the accounts that obtain more RT and classify them by the type of user to understand if news media users are more shared and influential than others. The study of the life of the most shared URL serves to measure which accounts start the sharing of news media URL (life of URL).
RQ5: How strong is the intermedia agenda-setting among news and social media? And between other news media channels (newspapers, news websites, and television newscasts)?
The dialogue about a corruption scandal is hypothetically strongly based on news media reporting and its intensity and emphasis. It is to be expected a strong influence of news media and journalists users on Twitter. To study this, we employ some of the tools used in RQ4 and analyze the correlation in time series of various news media channels and news outlets.
RQ6: How are news media outlets using Twitter? How much are news media and journalists driving the attention of the Twitter conversation?
News media circulate the most prominent stories on their front pages (if they have), home pages, and social media. A strong correlation is to be expected between what news media publish and Twitter conversation. We will track tweets of news media-related users and compare them to other users’ tweets; their RT, % they are scandal case study related; compare the sharing of URL and home page use; compare URL sharing and home article ranking.
In Sec. 15.5 Research questions summary (p. 666) in the Annex, there is a list of these six research questions with the results.
5.3 Making questions with drawings #
A visual schematic approach to agenda setting
One of the main focuses of this dissertation is to explore the potential of data graphics for agenda-setting analysis. More specifically, the goal is to analyze how corruption news coverage influences public opinion and when and under which conditions corruption has a more substantial impact on public opinion. The available data series have different time aggregations: hourly or daily data for news coverage –i.e., they are considered continuous in time1– and monthly data for opinion – i.e., they are considered discrete–.
Every day, new articles are published on newspaper front pages. When the coverage of a topic is measured –by counting the number of news items or relative space devoted to a story–, and it is represented as daily columns or as a curve, if the data points are connected, we obtain the shape of the news coverage.

The discrete values from daily front page data (Fig. 86) can be approximated to a curve representing the evolution of the space provided by the average coverage of different new outlets to one particular topic, issue, or news story.
In an attempt to describe what can happen after a scandal breaks out and is covered by multiple news media outlets, we show in the following prospective drawings (Figs 2-6) the evolution of the amount of coverage (🟥 red line) is shown together with public opinion (🟦 blue dashed line). The vertical axis represents both the intensity of news coverage (left axis) and the public opinion response (right axis). The blue line represents the public opinion survey date.
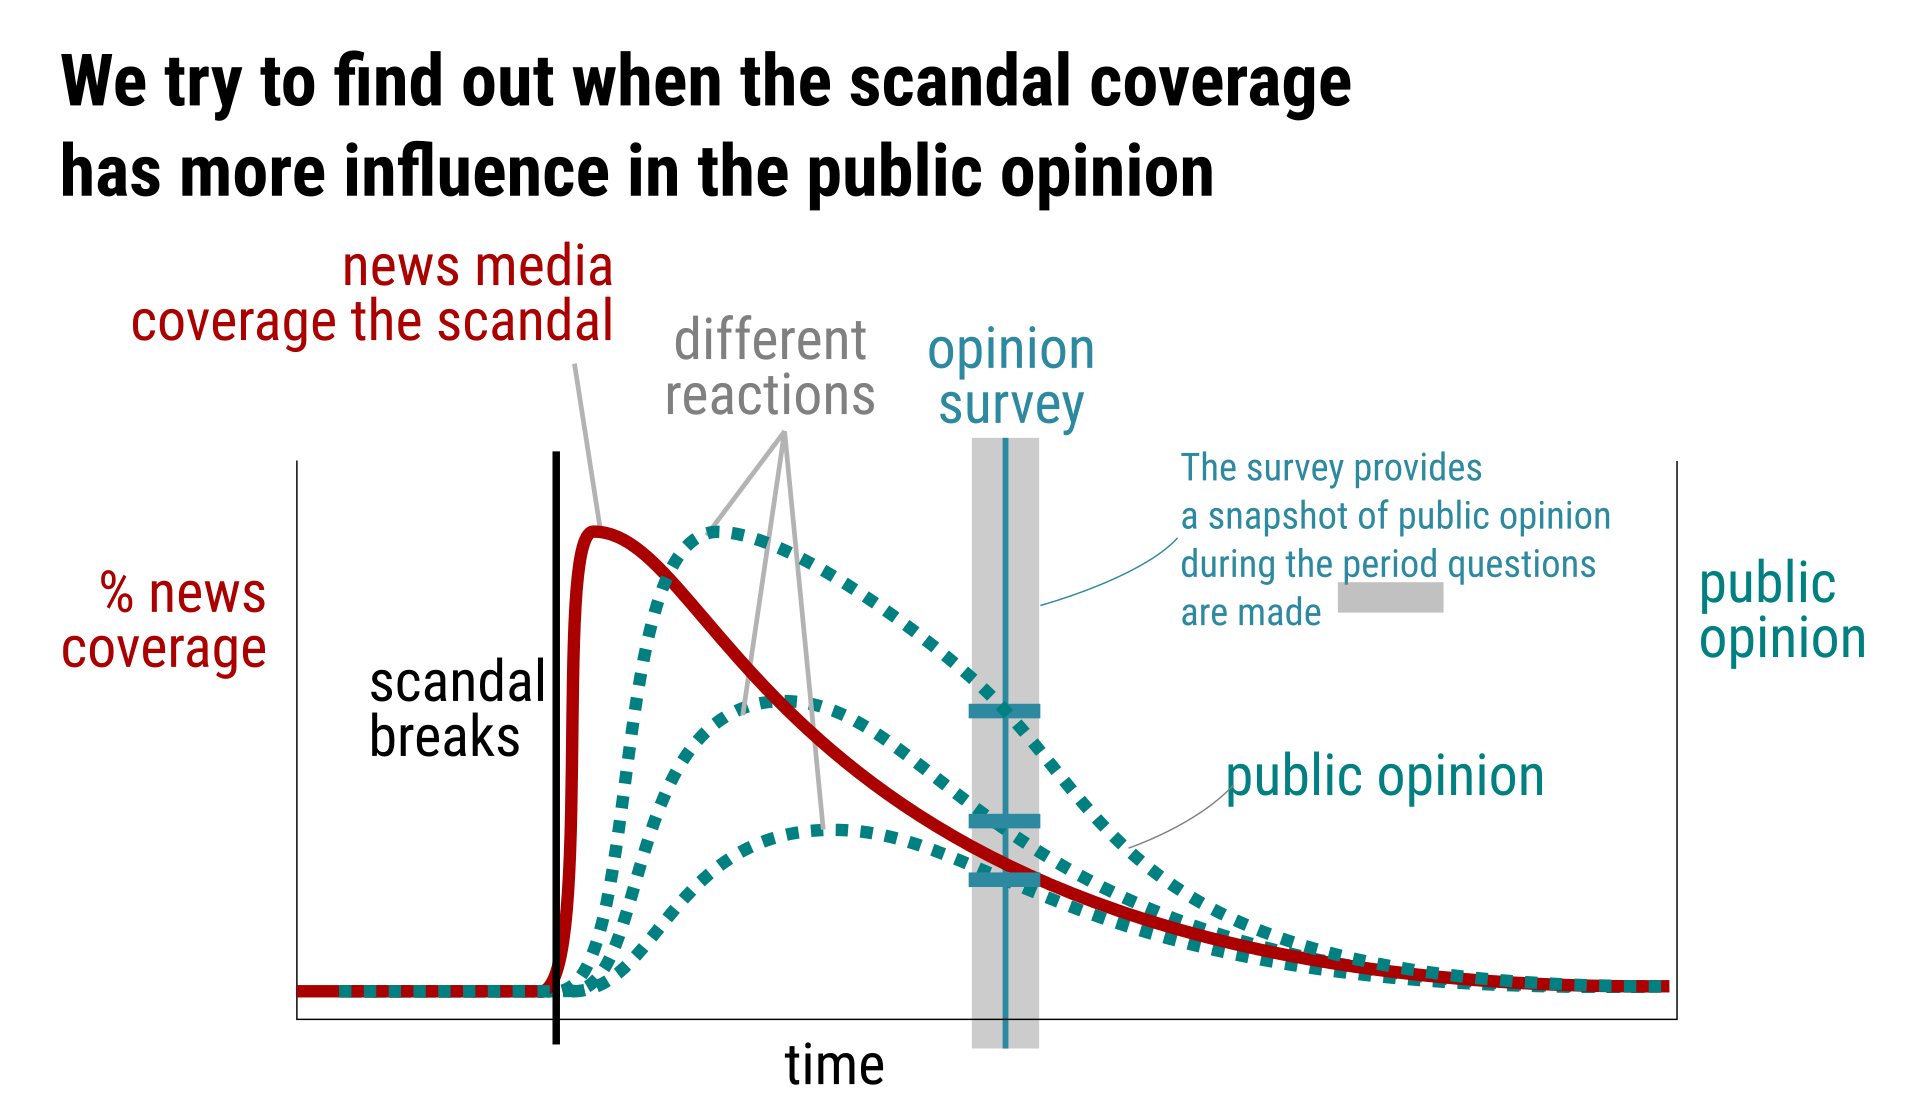
The public reacts to the published stories and builds its image of the scandal through a cognitive process that may or may not lead to behavioral change. The media’s agenda sets the public agenda (and mindsets) or at least influences it. According to the agenda-setting theory, the news agenda tells people what to think about and sets the basis of the most important issues. The three blue dashed lines in Fig. 87 represent possible shapes that public opinion evolution might follow. In some, the impact in opinion is closer to the news coverage peak, while in others, it is more distant and smaller.
Opinion surveys are the most extended way agenda-setting studies measure the importance of one particular issue in public opinion. Polls are snapshots of what people think and think about at a given moment. To be precise, they are not conducted in one single moment in time, as depicted with the blue line in the drawing. The process depends on the survey’s design and can take from a few days to months. This issue is addressed later (see sections 7.6.2 Public opinion surveys: CIS Barometer and 8.1.3 Selecting window size for news media coverage), together with the related problems; here, it is enough to note again that opinion data are considered “discrete”, compared to the “continuous” news coverage data series.
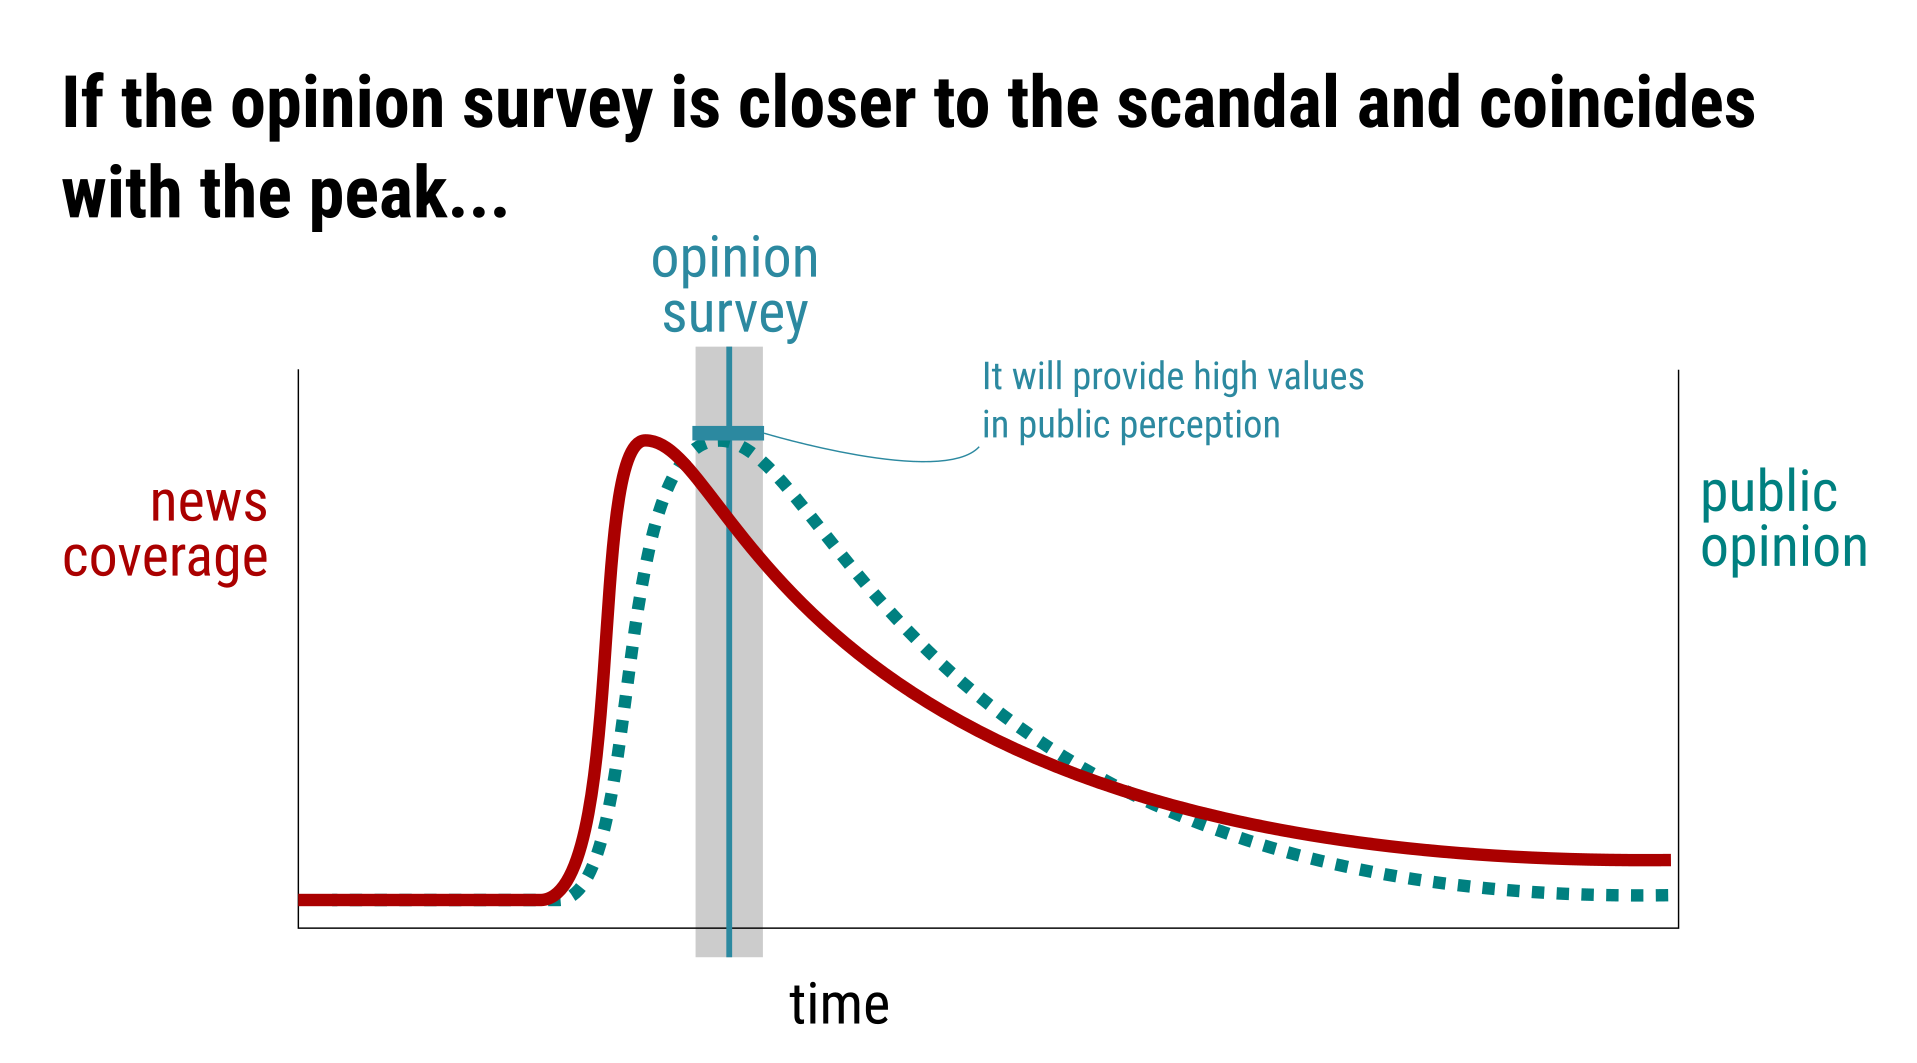
To study the relationship between news coverage and public opinion it is key to know when and for how many days the survey is conducted in relation to a particular scandal coverage. Gallup polls are conducted in 2 or 3 days, but CIS barometers usually take a week or more to be completed. If the survey’s date is close to the date the scandal breaks, that is, if the peak of public concern is synchronous or very close to the survey, higher values of public concern are expected (Fig. 88).
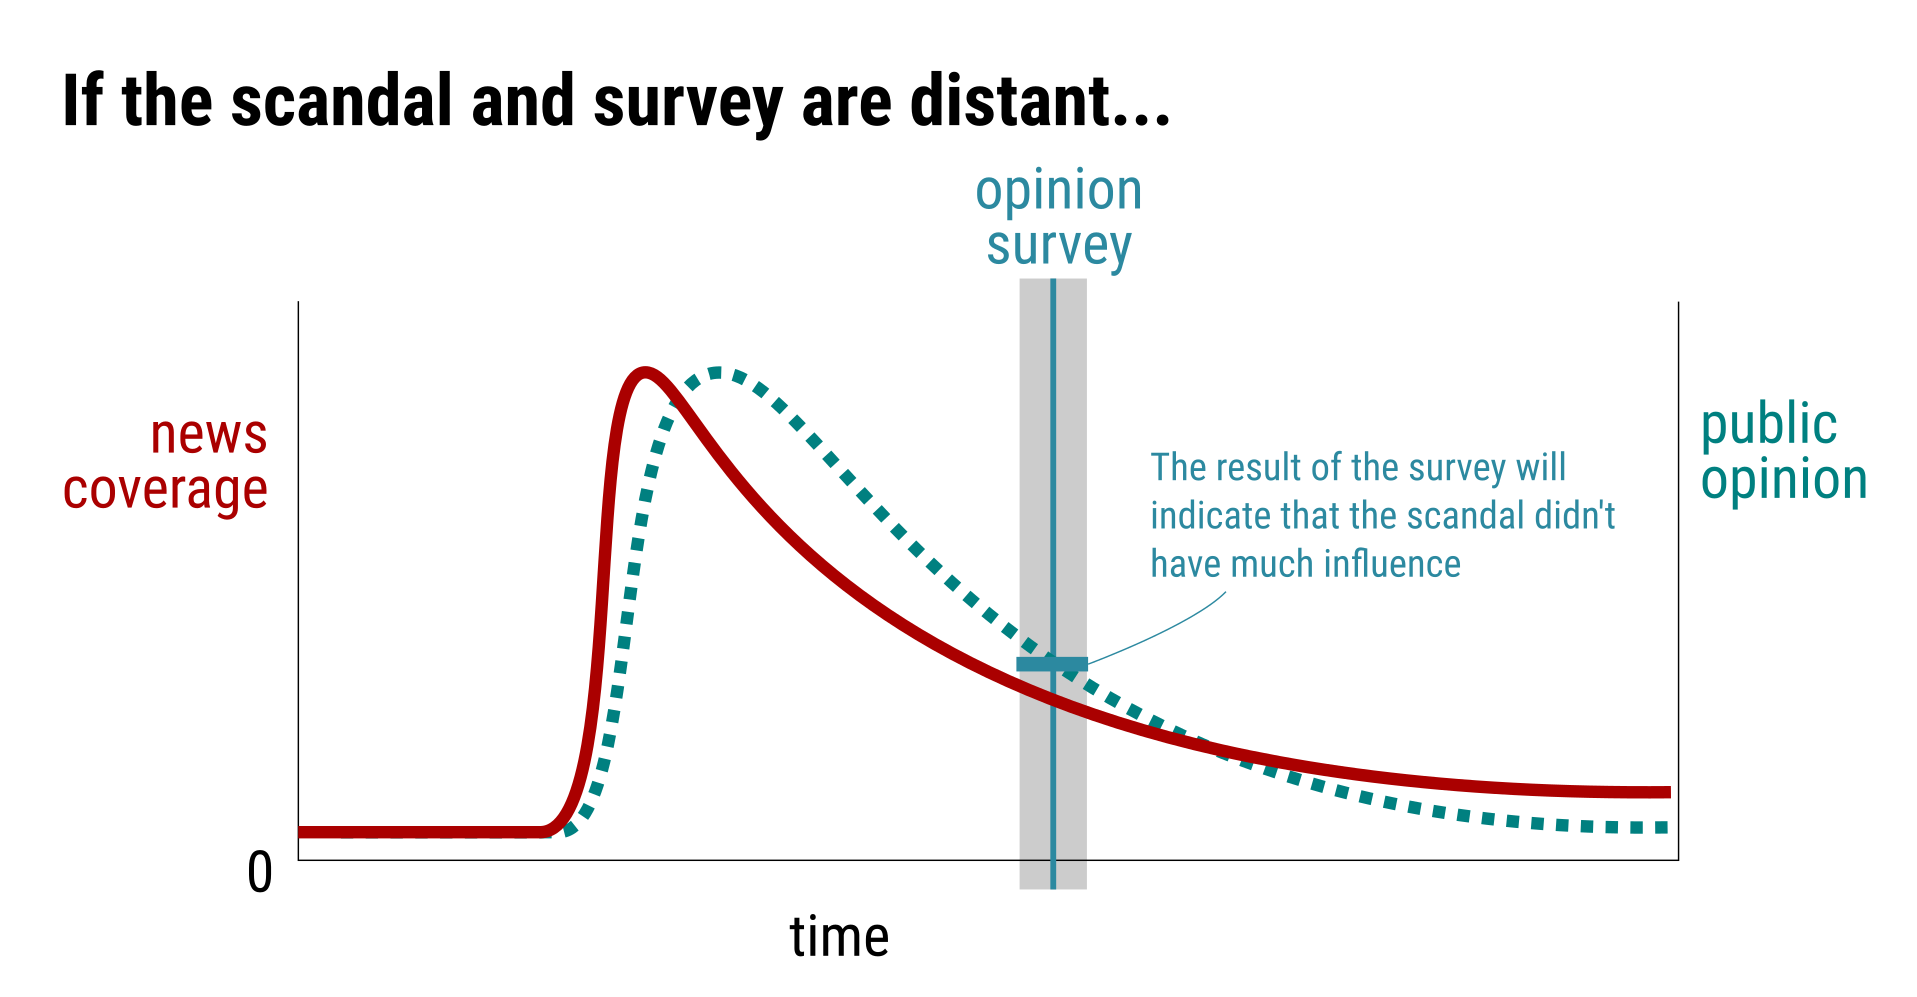
On the contrary, if the opinion survey is done weeks after the news coverage’s peak, lower values in the survey for the same supposed opinion curve will be obtained, following this hypothesis (Fig. 88). The evolution of opinion is the same, but opinion is measured at a different stage.
As mentioned in previous chapters, various studies indicate different periods of influence depending on the news media channel analyzed, the type of story or issue (obtrusive, non-obtrusive), the newsworthiness, the need for orientation, and if it happens during an electoral period.
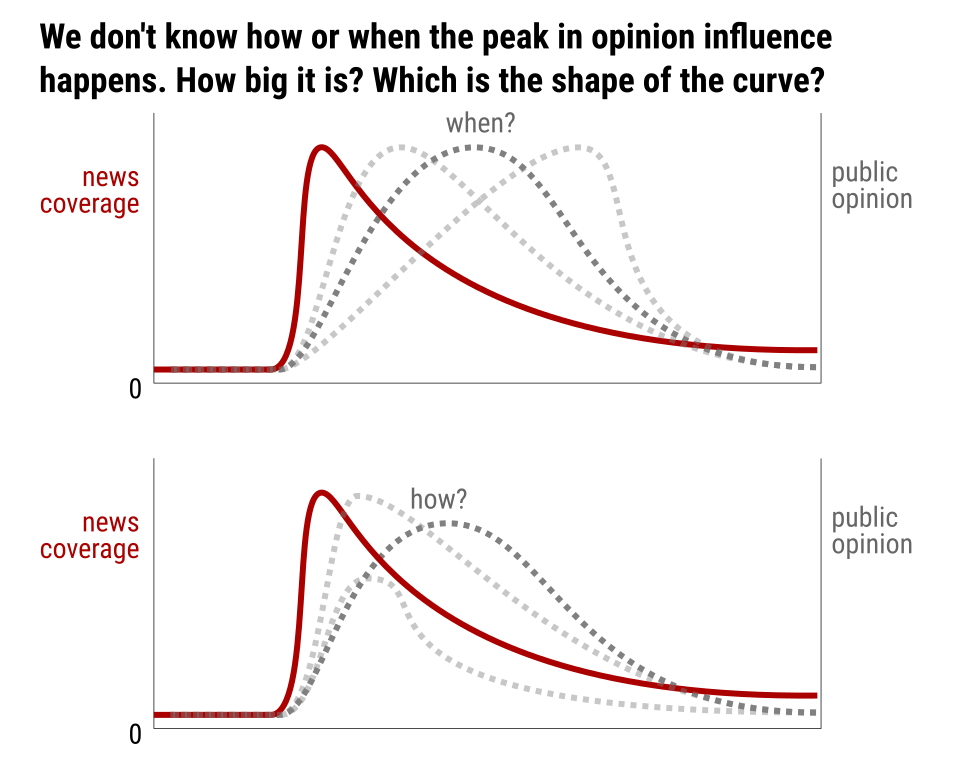
The exact (“real”) shape and size of the opinion’s curve is unknown (Fig. 90). The drawing is just a working hypothesis. These sketches lead to two hypotheses: (a) both curves (news coverage and public opinion) have a similar shape, separated by a time lag; (b) the shape of the curves approximates an exponential decay function, in which media coverage, after a first fast increase, start decreasing, and so does the public opinion related to that coverage. This exponential decay shape, while heuristic, is based on two different approaches: the curve seen in other front page analyses (Rey-Mazón, 2013) and in studies that use the effect of cumulative coverage with memory decay (Watt et al., 1993), that presents a function to mimic the way people forget about distant events in time and remember better (have more influence) events closer in time.
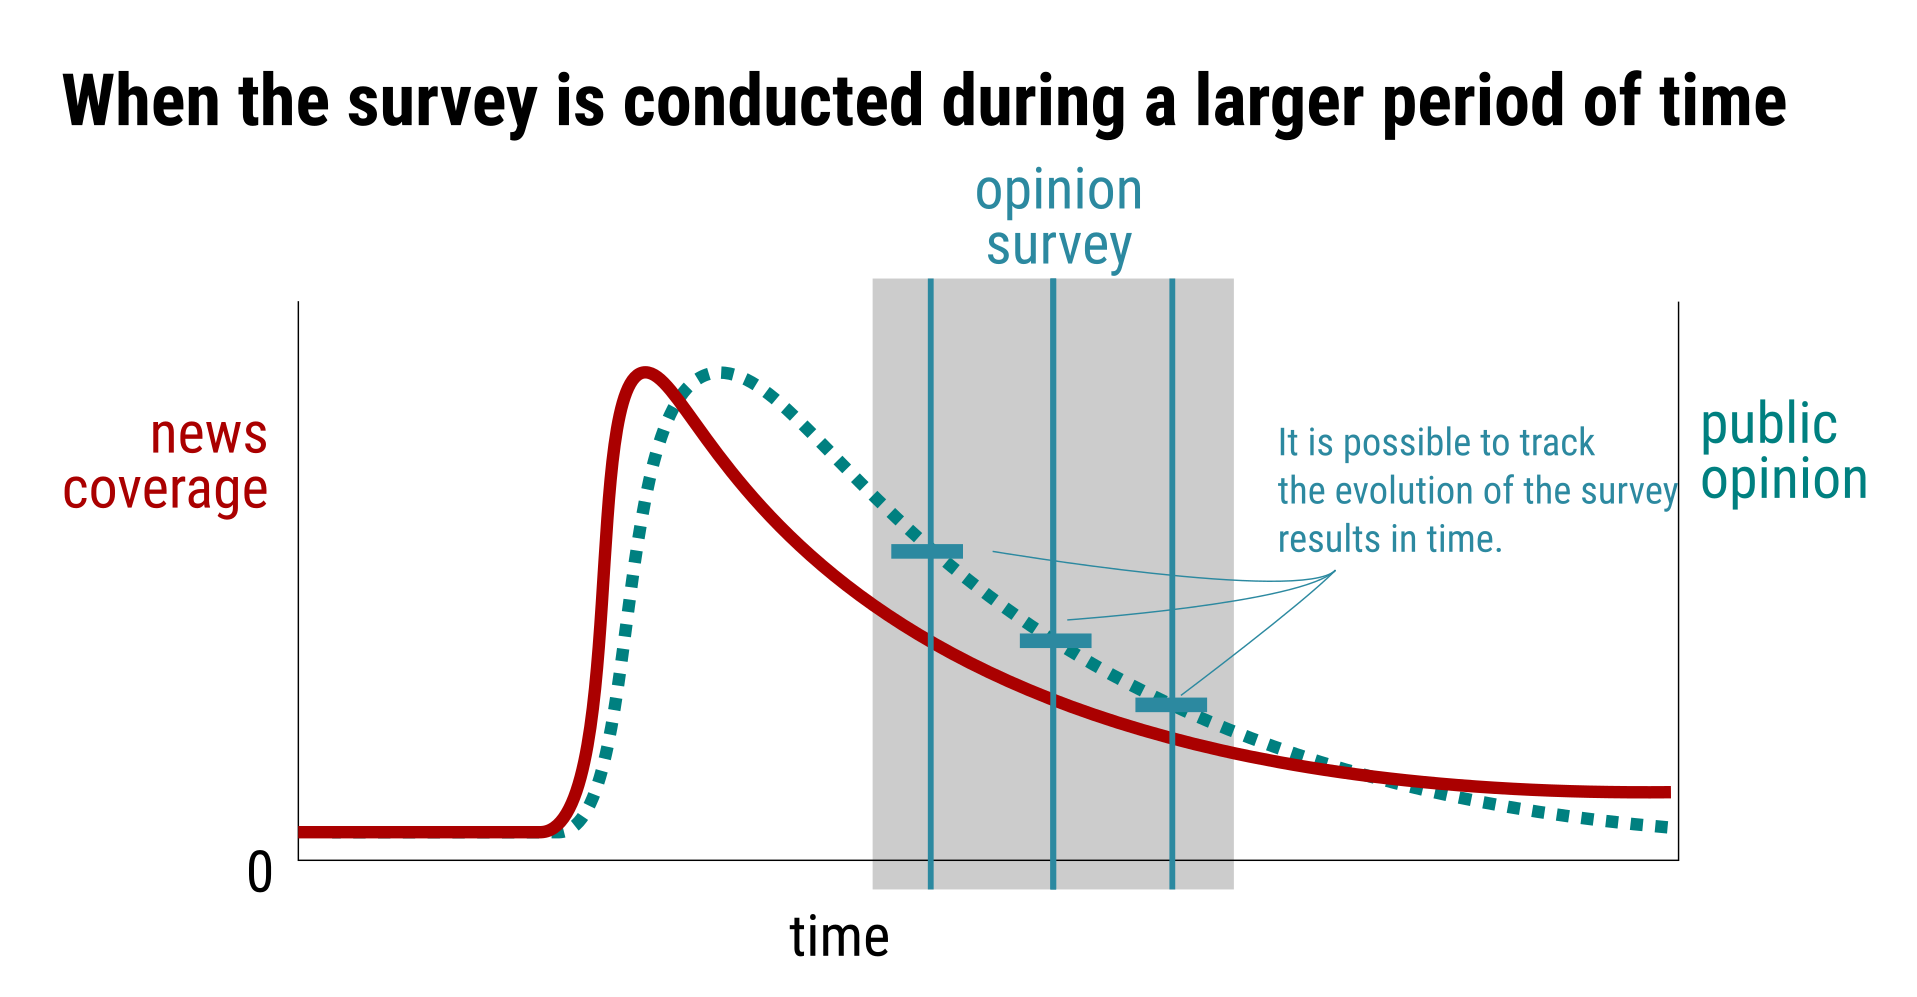
The critical issue here is that opinion surveys provide a single value in time, or at least they are used as if they only offer the public opinion in a very specific time2. This issue is, however, not always the case: some surveys take weeks to conduct, like the European Social Surveys, which have been used to conduct natural experiments or quasi-experiments like Ares & Hernández (2017) and Legewie (2013). Scholars have studied public opinion before and after a scandal following the evolution of responses in time (Fig. 6). This methodology is explored in section 8.1.1 (Fig. 188). The problem with CIS barometers is that the daily number of answers per region is insufficient to have statistically significant results to build a weighed response for the whole country. Studying this is only possible in certain regions, where the number of surveys is high enough.
In the following chapters, we will provide answers to understand how and with which strength news coverage influences public opinion by measuring when the peak happens, if it happens at all, and how significant the impact is on public opinion3.
1Front pages are strictly discrete, one by day if we compare them to the continuous updates of online news sites and social media.
2The mean duration by year of CIS barometers was from 6.8 to 10.1 days on average for the 2002-2011 period. Macrobarometros are conducted for more extended periods.
3Wanta & Hu (1994) studied time-lag differences in the agenda-setting process, and they noted many discrepancies among different previous studies that range from time frames as short as one week and as long as months. They suggest that the media used to conduct the analysis (TV, newspapers, magazines) may result in different optimal agenda-setting time-lags.
Bibliography of this chapter #
Ares, M., & Hernández, E. (2017). The corrosive effect of corruption on trust in politicians: Evidence from a natural experiment. Research & Politics, 4(2), 2053168017714185. https://doi.org/10.1177/2053168017714185
Legewie, J. (2013). Terrorist Events and Attitudes toward Immigrants: A Natural Experiment. American Journal of Sociology, 118(5), 1199–1245. https://doi.org/10.1086/669605
Rey-Mazón, P. (2013). Newspaper Front Page Analysis: How Do They Tell the Story? In Accountability Technologies: Tools for Asking Hard Questions. Springer. https://numeroteca.org/2013/06/18/newspaper-front-page-analysis-how-do-they-tell-the-story/
Terrasa, R. (2021). La ciudad de la euforia. Una hipótesis de la mafia. Libros del K.O.
Wanta, W., & Hu, Y.-W. (1994). Time-lag differences in the agenda-setting process: An examination of five news media. International Journal of Public Opinion Research, 6(3), 225–240. https://doi.org/10.1093/ijpor/6.3.225
Watt, J. H., Mazza, M., & Snyder, L. (1993). Agenda-Setting Effects of Television News Coverage and the Effects Decay Curve. Communication Research, 20(3), 408–435. https://doi.org/10.1177/009365093020003004