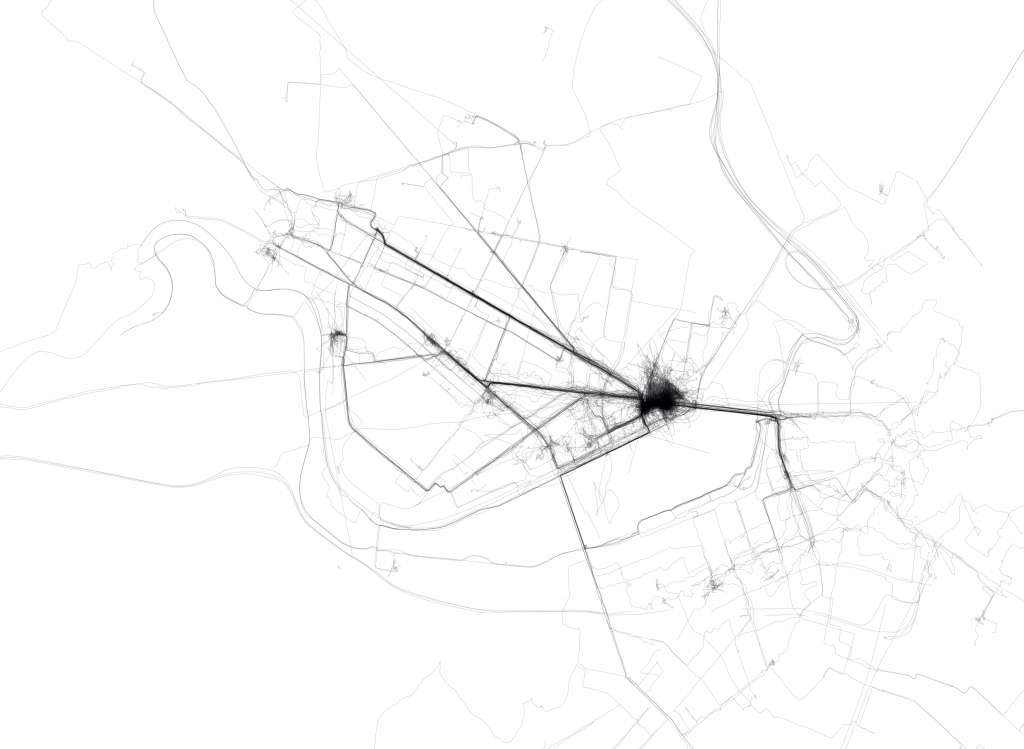
I could have also said: “All the places I went last year”, but it would not be that accurate. Instead of yuxtaposing the raw gpx tracks, I found that giving them a transparency they would tell the story better. The black spot is the consequence of not turning on the GPS in closed spaces (noise).
How to:
- Record every movement you make with a GPS.
- Download all the .gpx files from your GPS.
- Merge all your recorded tracks (.gpx files) with Merge tool (Windows).
Run the program inside the folder and it will merge all the gpx files in one. - Open the generated .gpx file into JOSM. Convert the layer to a data layer (right click button) and you’ll be able to edit the points. Save the layer as another (clean) .gpx file.
- Open Qgis and import the gpx from last step (seen in cartotalk).
- Create a new layout, insert the map and export to pdf or svg.
- Open it in inkscape (or illustrator, or freehand) and put the lines with transparency 25%.
- If your computer is ‘strong’ enough you’ll be able to export/print the resulting image (I had some problems with it).
Note: It might be a little bit to intimate to show all this traces, but it looked so nice that I had to post it. Years ago I did a similar map drawing with a pilot every movement I made on a Madrid touristic paper map. I never published it. Different tools, same story.

Jeffrey Warren says:
que lindo…
veo el pirateship, o quizas Market Basket. Y descubri una ruta nueva, mas eficaz… chevere.
p says:
Aquel que conozca el lugar, podrá entender todos los secretos que el mapa esconde. En el río que no es río (el Charles), se puede ver el paseo en barco de vela de una tarde de verano.