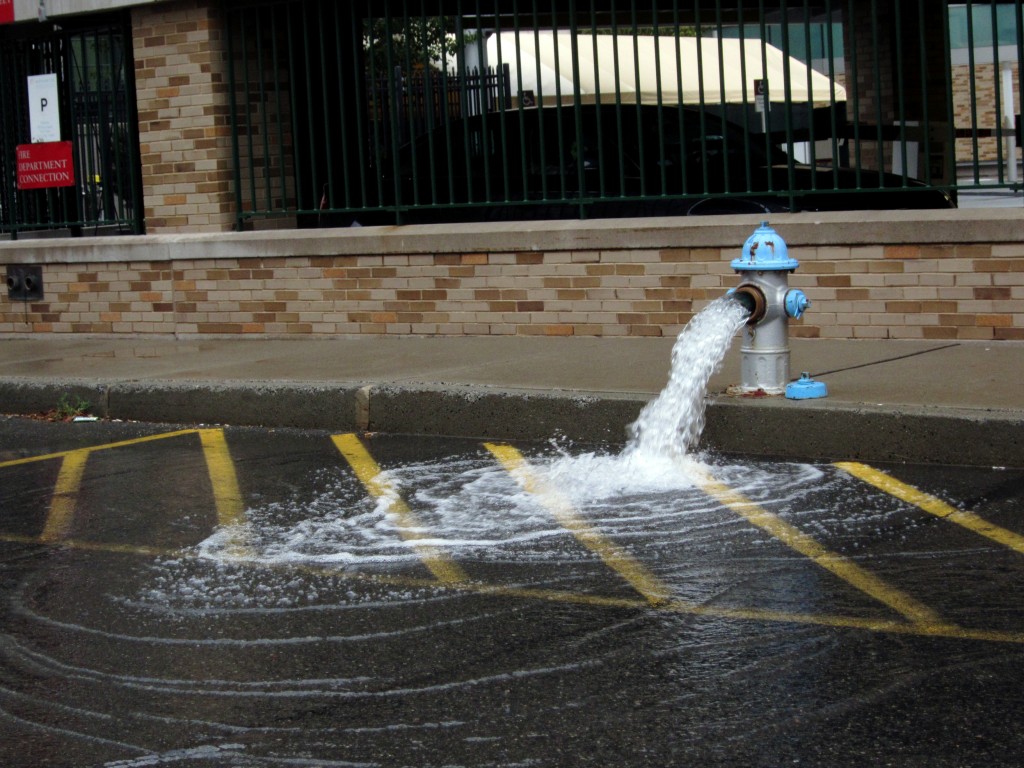
Find it in Somerville, MA. USA.
It is like to drink from a fire hydrant
Vuelven las portadas #primaveravalenciana
No es que se hubieran ido, pero acaso porque esté yo más sensible al tema, no paro de ver noticias que hablan de portadas y más portadas de prensa. Ese elemento que los periódicos de papel se reservan para dar su grito, y que es comentado en la radio, televisión, webs y redes sociales de internet. Parecía que Inernet iba a matar pronto a al papel, pero las portadas en papel siguen teniendo su audiencia y se resisten a ser borradas del mapa mediático. El periódico Público acaba de perder su lugar en el kiosko (25 de febrero), y el gráfico por lo menos sirve para dejar ver el hueco que deja, que acrecienta el desequilibrio entre medios de comunicación qde derecha e izquierda en España.
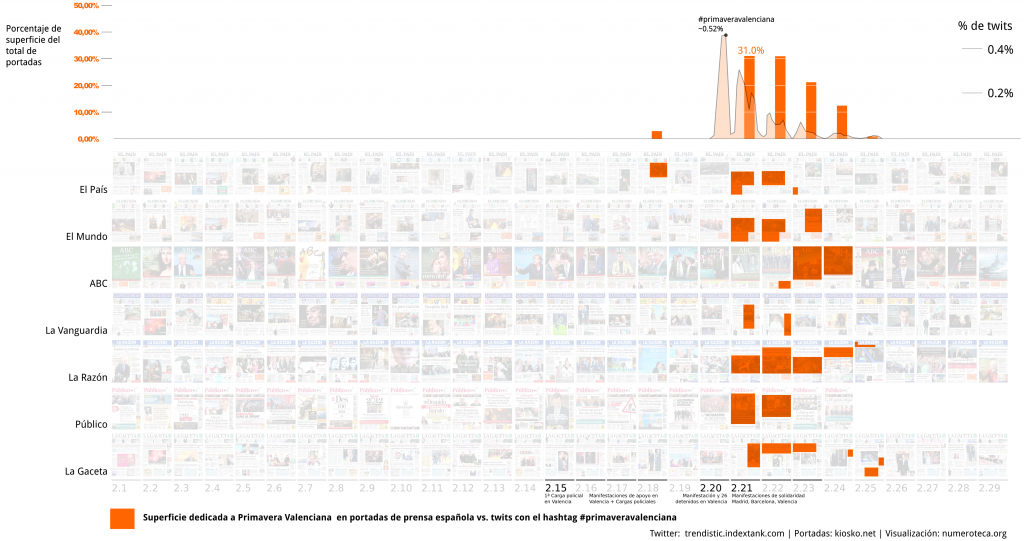
En el gráfico de arriba se relaciona la superficie dedicada en las portadas de prensa española a la llamada “primavera valenciana” en relación a los twits con el hashtag #primaveravalenciana. Las manifestaciones y cagas policiales comenzaron el 15 de febrero, pero hasta el día 21 no se convirtieron en primera página para la mayotía de diarios. El lunes 20 #primaveravalenciana llegaba a su pico y era trending topic, cuando se detuvieron a 26 personas tras las manifestaciones en Valencia. Un análisis posible sería ver de qué hablaban y cómo estas noticias para aportar no solo cantidad (superficie) sino un análisis cualitativo. Estamos pensando aplicar la metodología que usó Victor Sampedro Blanco en su análisis de la prensa sobre la insumisión en los años 80-90 en España y cómo se configuran las agendas políticas y mediáticas. Todo llegará.
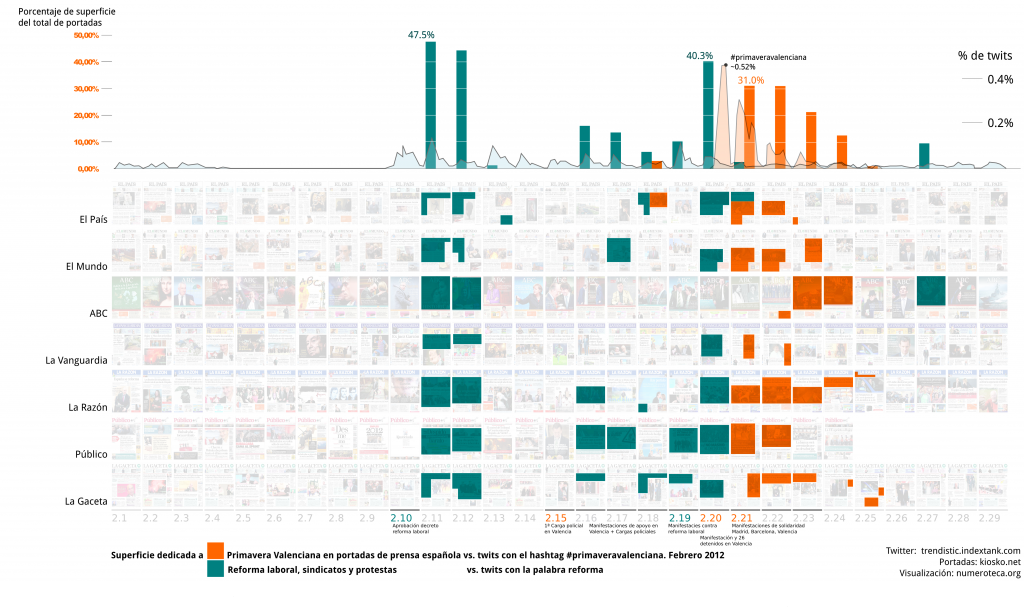
Para no deternos ahí y seguir analizando otros elementos interesantes de los movimientos sociales en febrero, hemos incluido las noticias relacionadas con la reforma laboral, los sindicatos y la manifestación del 20 de febrero. También aquí podríamos diferenciar entre los diferentes tipos de noticia. Valga por el momento esta prueba. Se incluyen los twits con la palabra “reforma”.
Con este gráfico queremos retomar el estudio de las portadas en la prensa para ver cómo configuran la agenda política y social y cómo se relacionan con los movimientos sociales. (Nota: Faltan por incluir, las portadas relacionadas con las protestas en Atenas).
Noticias y post con portadas de por medio:
- El método del incendio del Reichstag en Guerra Eterna
- Las portadas Mordaza en Guerra Eterna
- Portada de ABC sobre #primaveravalenciana “corregida”
- Sigue las #portadasABC, están marcando época
Así que parece que las portadas tienen cuerda para rato.
Downloading and erasing you google search history #unGoogle
Tomorrow March 1st all the Google services will be connected. Before erasing your search history (all the things you googled while your gmail account was opened) you can download and play with it. I’ve found a cool script by Geekland that does that for you. It converts the yunkie xml from the rss that your searches automatically create (https://www.google.com/history/lookup?q=&output=rss&num=1000&start=1) into a cvs format. You can play with the variables:
- num Number of records to output (1000 is the most you can get a time)
- start: The record number starting point (starting from 1)
Read more info RSS feed parameters
Soon: how to play with your downloaded csv.
More info about ungoogle in Spanish.
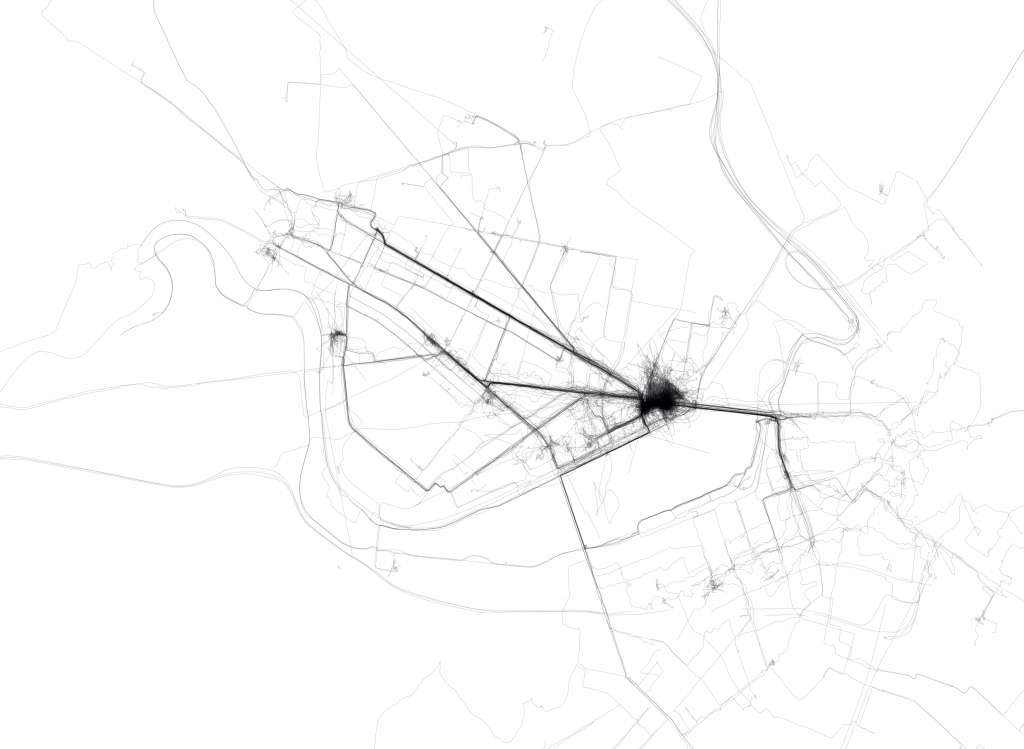
My GPS traces from last year in Cambridge
I could have also said: “All the places I went last year”, but it would not be that accurate. Instead of yuxtaposing the raw gpx tracks, I found that giving them a transparency they would tell the story better. The black spot is the consequence of not turning on the GPS in closed spaces (noise).
How to:
- Record every movement you make with a GPS.
- Download all the .gpx files from your GPS.
- Merge all your recorded tracks (.gpx files) with Merge tool (Windows).
Run the program inside the folder and it will merge all the gpx files in one. - Open the generated .gpx file into JOSM. Convert the layer to a data layer (right click button) and you’ll be able to edit the points. Save the layer as another (clean) .gpx file.
- Open Qgis and import the gpx from last step (seen in cartotalk).
- Create a new layout, insert the map and export to pdf or svg.
- Open it in inkscape (or illustrator, or freehand) and put the lines with transparency 25%.
- If your computer is ‘strong’ enough you’ll be able to export/print the resulting image (I had some problems with it).
Note: It might be a little bit to intimate to show all this traces, but it looked so nice that I had to post it. Years ago I did a similar map drawing with a pilot every movement I made on a Madrid touristic paper map. I never published it. Different tools, same story.
Frontpage analysis tool in github
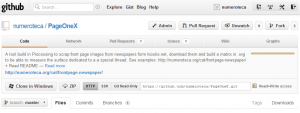
I’ve just uploaded to Github (opensource repository) the tool (in Processing) to scrap, download and build the matrix of newspapers frontpages: https://github.com/numeroteca/PageOneX Update 13.11.12: Renaming https://github.com/numeroteca/pageonex-processing Feedback welcome. See examples. By the way, this is the first “aside” of this blog.
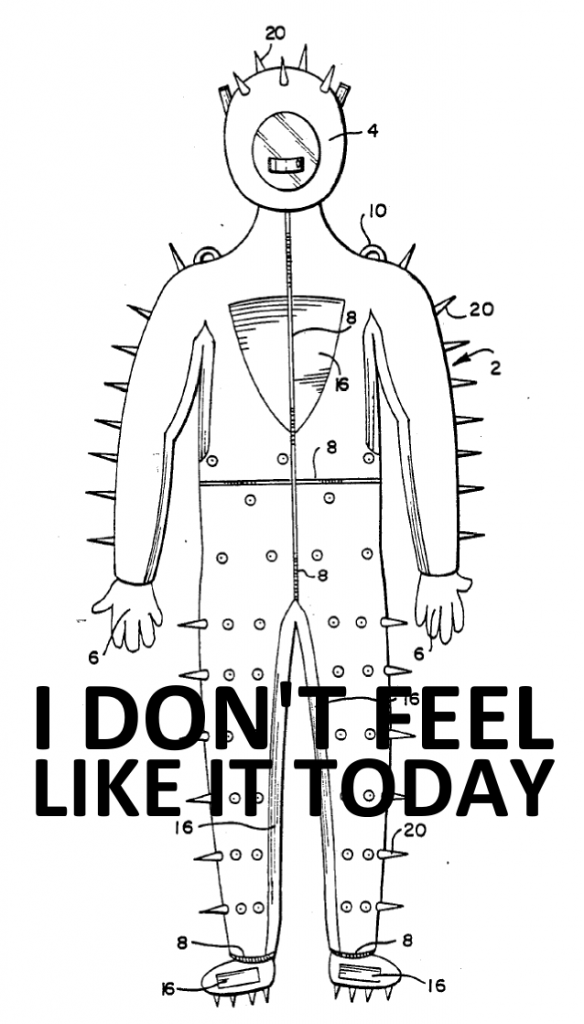
I don’t feel like it today
The way it works
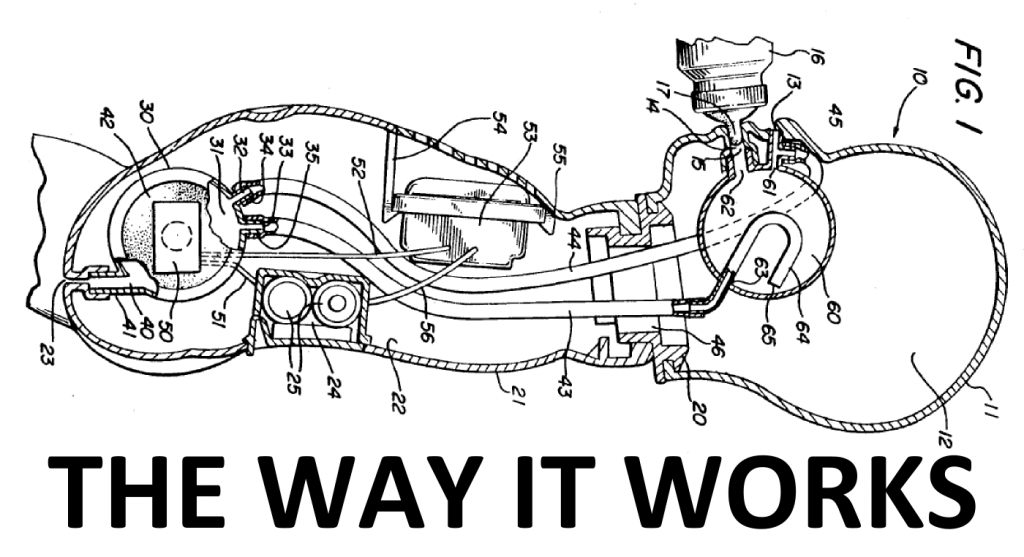 Thanks to William J. Kelley.

