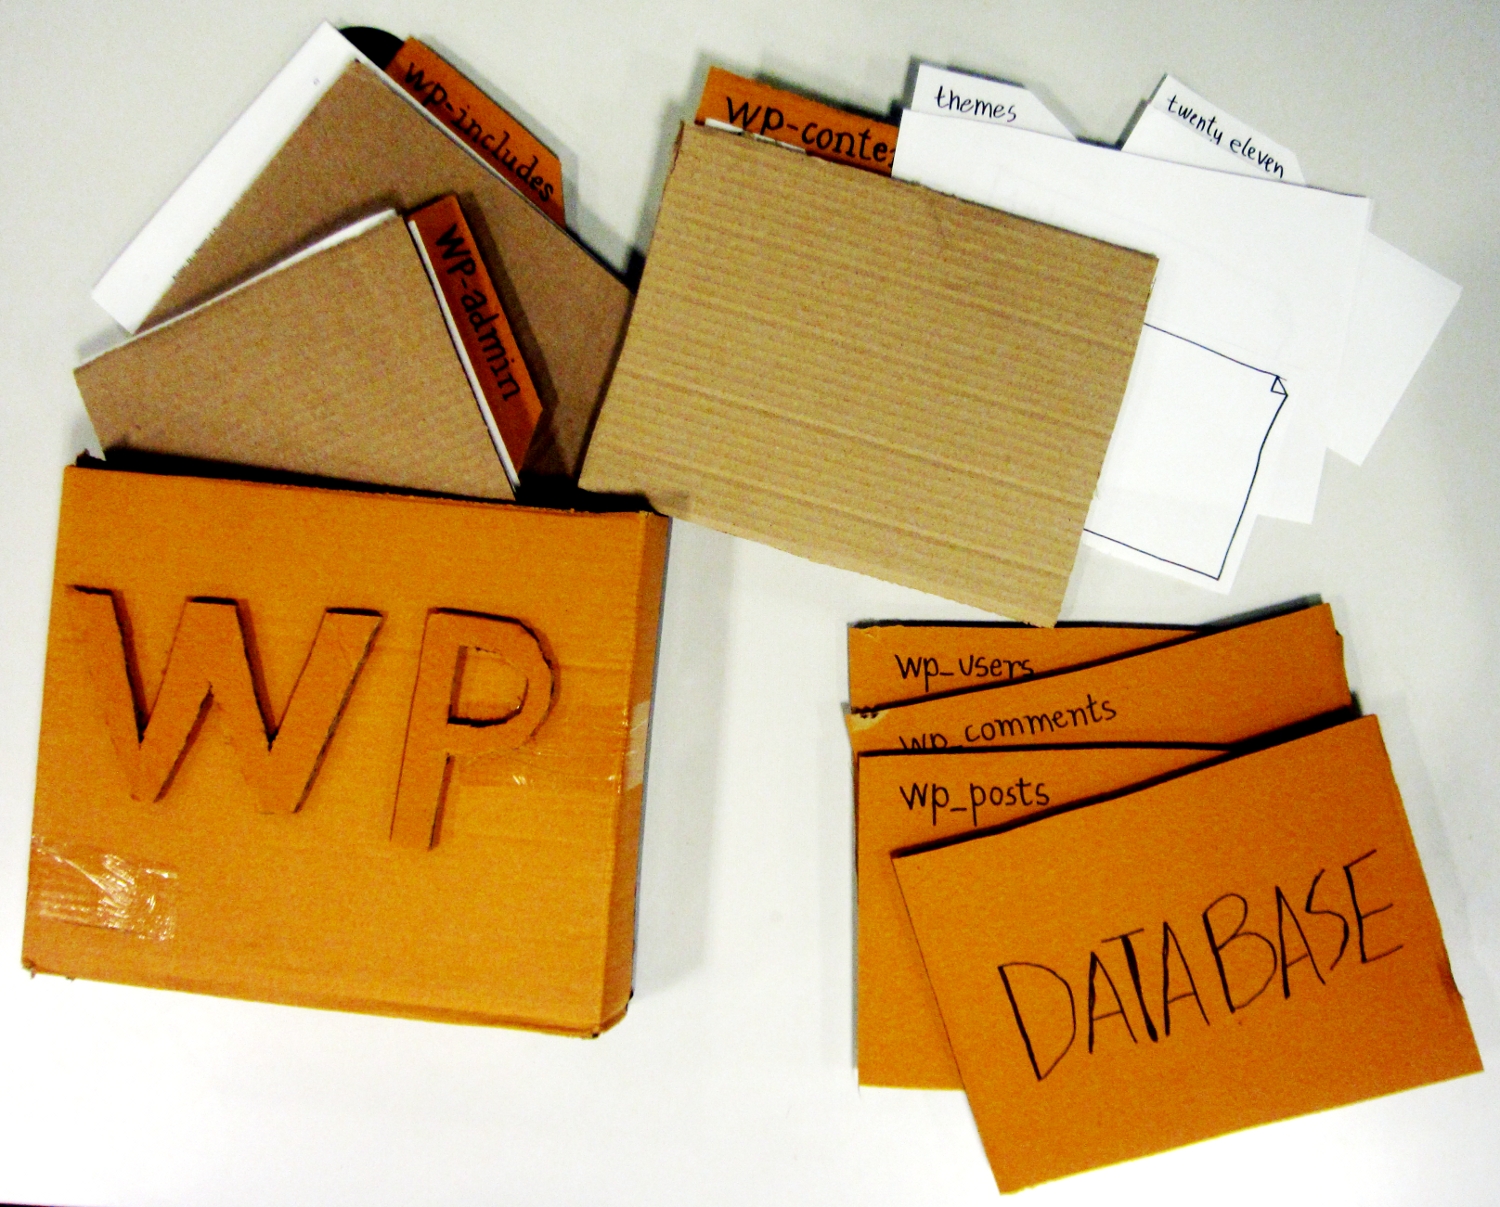
It is a good time to give back all the things I have learnt from WordPress. Today I’ll be giving an introductory class with cardboard folder and data bases in the Festival of Learning 2013 at Media Lab. More info + session.
It is a good time to give back all the things I have learnt from WordPress. Today I’ll be giving an introductory class with cardboard folder and data bases in the Festival of Learning 2013 at Media Lab. More info + session.
Josh Begley developed a script that outputs a list of googlemaps images given a list of locations (longitud and latitude needed). It runs in Processing and uses the Google Maps API. It was originally used to get aerial images of all the prisons in the USA. I thought it could be interesting to get googlemaps images from all the urban developments that were built and unfinished during the real estate bubble in Spain. I’ve opened a spreadsheet http://bit.ly/listapaus with a few of them to test the script.
This is a side project to the 6.000km map, a kind of wiki to collect info about urban metabolism in the era of the real estate bubble in Spain. Soon, we will have updated photos of some of these places, that we just took in Madrid with balloon mapping techniques.


")


El infierno real puede estar aquí (si tu navegador y tu conexión aguantan los n vídeos a la vez).
Acutalización 24 diciembre 2013: Puedes ver la versión El infierno real 2.0 mejorada Continue reading


I just left my first superminiresearch note in the Public Laboratory website.
One of the sticks from Dani’s kite was broken, so we substitute it with a fiber glass safety marker 72″, like this one, that Jeff Warren had given me.
It was easy to cut it with a saw, and to give its shape to make it fit in the kite.
I think it is a great way to make easy for users/supporters to provide ideas or feedback. As it is a “note” it looks easier to post something than if it were a “post”.

Working in Basurama usually means working in different countries with different tools and waste materials. When we have to prepare those actions/workshops/installations, we have to send a list of the tools we’ll need. Even for Spanish speaking countries, names of tools could differ a lot. A trolley (or is it a dolly?) could be a carretilla if you are in Spain or a diablito if you are in Mexico.
To try to solve this problem, I’ve started a spreadsheet with photos and names of different tools and materials, that we usually use: http://bit.ly/toolstranslate
This spreadsheet could then feed other websites or be copy-pasted (and removed the columns that are not useful) to serve as a template for a tools request.
Everyone can edit it. Thanks for collaborating!
Here it is a comparison among different ways of making bar charts and embedding them in a wordpress blog. I’ve testing them for kulturometer.org, a project devoted to research the cultural budget that the city of Madrid is spending.
The data used: Once a year the Madrid city hall publishes a pdf with these data in a non reusable format. We’ve been extracting manually these numbers in the last 5 years and published them in a google spreadsheet (see the data set in csv format at the end of this post).
The idea of this post is to compare and review these 4 5 different methods.
Update: added gnumeric after Madeleine comment. It’s the simplest and more customizable method (though not intractive).
Advantages
Easy to upload data, and collaborate with others.
Easy to generate simple bar charts and embed them as images (as interactive script you may have some problems when embeding in a blog ).
No programming skills needed.
Drawbacks
Even now, that it is possible to customize a lot of the visualization, it is still not possible to change bar height (or width), for example.
Advantages
Drawbacks
Advantages
High customization possibilities.
Produces .svg code ready for the web.
(Interactive possibilities, I haven’t explored them yet).
Drawbacks
Javascript knowledge needed.
Advantages
High design and interaction customization possibilities.
Produces .svg code ready for the web.
Drawbacks
Processing knowledge needed.
You’ll need to export it with Processing.js, that makes your visualization work using web standards and without any plug-ins.
Advantages
No extra program needed.
Highly customizable: colors, ticks in axes, units, fonts.
Produces clean .svg
Drawbacks
No interactive graphic.
Three updates about the PageOneX:

Hace poco descubrí la posibilidad de buscar imágenes similares en google images sin necesidad de un smart phone. Basta(ba) con arrastrar la imagen deseada a la caja de búsqueda de google images, puedes ver los resultados que salen: todas las imágenes que utilizan parte de la imagen que estás buscando. También vale pegar la url de una imagen que ya esté online. Estuve probando con las diferentes fotos panorámicas de 6000km.org a ver si había algún uso interesante o alguna remezcla. Me interesaba también ver cuales imágenes del proyecto sobre los paisajes basura pre y post burbuja inmobiliaria habían traspasado las fronteras de la sala de exposiciones o de nuestra web. Continue reading