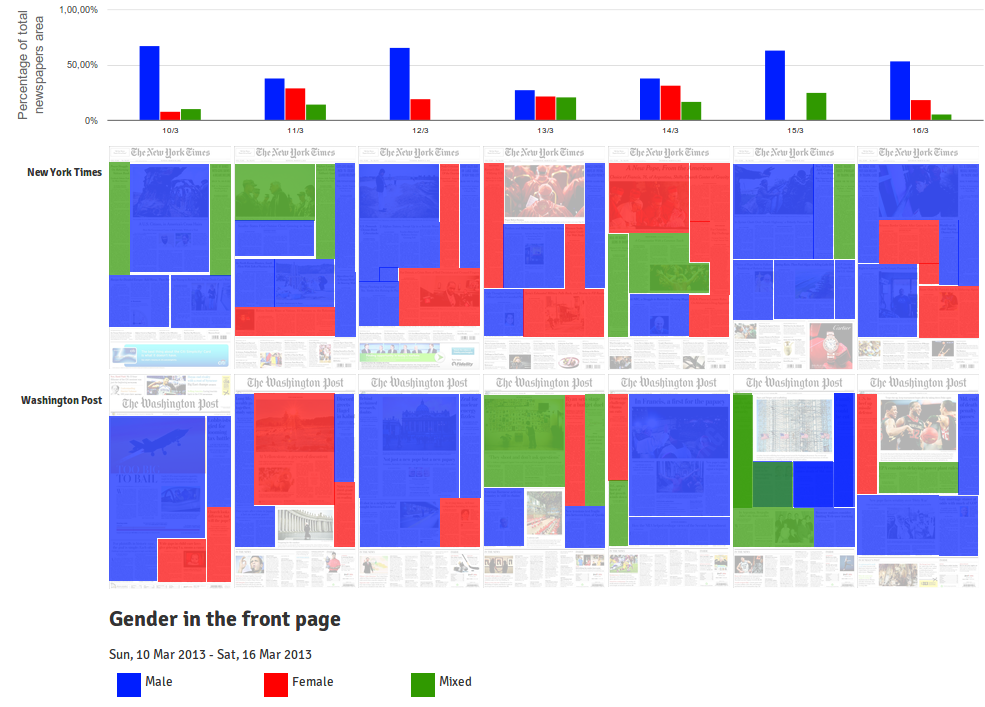
The best way to show the last improvements in PageOneX‘s development is by using them. After lasts Ed’s commits it is possible to draw as many rectangles as you need when coding a single front page, whereas before it was only possible to draw 2 rectangles per image.
I used this new feature to analyze the gender of the bylines: who is writing the news that are in the front page. It is inspired in the research that Nathan Mathias is developing about gender and the news. In his case, he’s written a script to analyze the byline automatically from online newspapers. Check Nathan’s posts about this topic: Gender in Global Voices, Women’s Representation in Online News, Data science for gender equality: Monitoring womens voices in the news and Women, news, and the internet: (almost) everything we know.
What is presented above is a visualization of the same kind of study, in this case, a infinitesimal portion (last week in two newspapers), and manually coded with the help of PageOneX. I only coded the articles that had the byline visible in the front page. The images that were not related to an article were left un-coded.
It would be interesting to compare the data obtained with this method with the ones obtained by a study by Women in Journalism “Seen but not heard: how women make front page news” (WiJ) that “found that 78% of all front page bylines were male; 22% were female”. Their research studied UK newspapers and their method was slightly different: they “counted the number of female and male bylines on each front page”, whereas PageOneX calculates the percentage of surface of the articles. Nevertheless, it might be interesting to compare results with a larger data set. WiJ’s study was a 4 weeks period and also analyzed the content of lead stories and photographs. It is worth checking the graphics based on these data by the Datablog (all the data are available) and the article by Jane Martinson.
I am particularly interested in how a tool like PageOneX might be able to make the coding process of news and its data visualizations faster, easier and more visually compelling. The coding process presented in this blog post took me less than one hour.
If you are interested in collaborating or using PageOneX you can join the developers’ listserv, the users’ email list or the newsletter.
PS: This new feature is not yet in the available in the alpha online version, but it soon will. Meanwhile you can download and install your own deployment.
–
Thanks Nathan Mathias for your contribution to this post.
