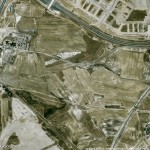
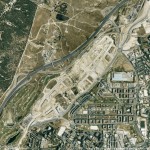
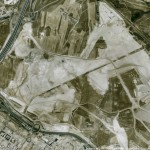
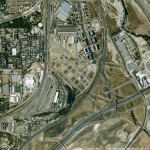
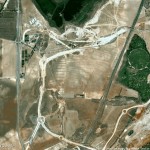
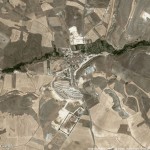
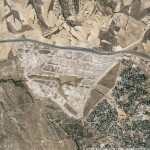
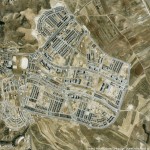
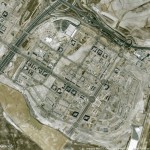
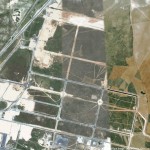
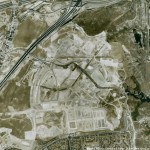
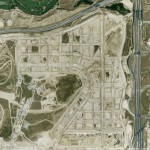
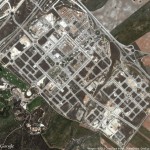
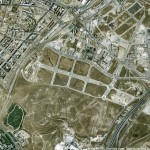
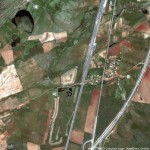
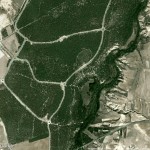
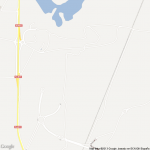
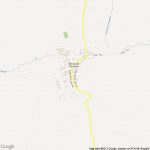
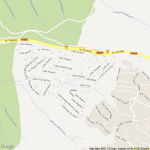
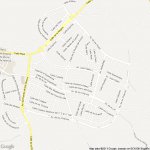
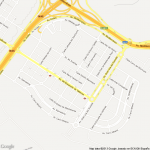
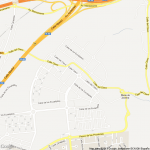
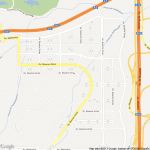
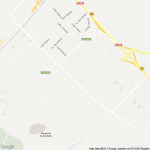
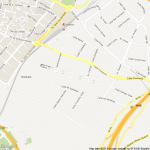
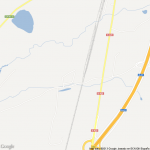
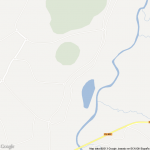
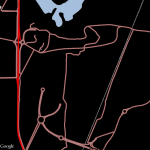
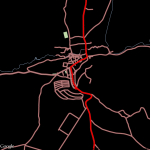
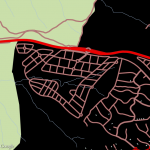
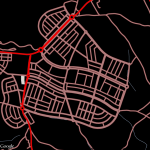
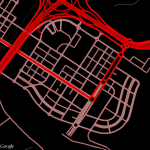
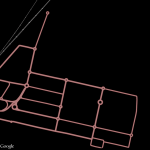
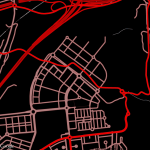
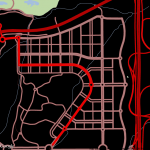
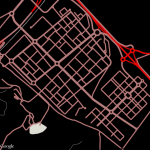
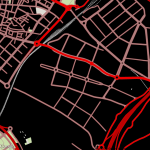
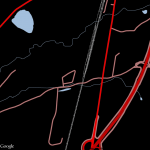
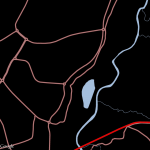
Josh Begley developed a script that outputs a list of googlemaps images given a list of locations (longitud and latitude needed). It runs in Processing and uses the Google Maps API. It was originally used to get aerial images of all the prisons in the USA. I thought it could be interesting to get googlemaps images from all the urban developments that were built and unfinished during the real estate bubble in Spain. I’ve opened a spreadsheet http://bit.ly/listapaus with a few of them to test the script.
This is a side project to the 6.000km map, a kind of wiki to collect info about urban metabolism in the era of the real estate bubble in Spain. Soon, we will have updated photos of some of these places, that we just took in Madrid with balloon mapping techniques.
- Ahijones
- Arroyo del Fresno
- Berrocales
- Butarque
- Reino de Don Quijote
- La Encina (Bernuy de Porreros)
- Majadahonda
- Miramadrid. Paracuellos
- PAU Vallecas
- Polígono industrial Aeropuerto Ciudad Real
- Rivas
- Valdebebas
- Valdeluz
- Viválvaro
- Villa Mayor de Calatrava
- Villanueva de Gomez. Avila
How to
Script in Processing (based on Josh Begley):
String[] paus;

void setup() {

}

void draw() {

paus = loadStrings("locations-latlon.csv");

for(int i = 0; i < paus.length; i++) {

String[] values = split(paus[i], ",");

String lat = values[0];

String lon = values[1];

String id = values[2];

PImage test = getSatImage(lat,lon);

test.save(id + ".jpg");

}

}

PImage getSatImage(String lat, String lon) {

String url = "http://maps.googleapis.com/maps/api/staticmap?center=" + lat + "," + lon + "&zoom=15&scale=1&size=640x640&maptype=satellite&sensor=false&junk=.jpg";

return(loadImage(url));

}
The locations-latlon.csv file should be in the same sketch folder. I downloaded the spreadsheet as a .csv (comma-separated value) file. I took the longitude/latitude data from OSM: http://www.openstreetmap.org/?lat=39.0472&lon=-3.92153&zoom=16&layers=M, you can see it in the url bar once you click in the “permalink” (bottom right).
locations-latlon.csv file content:
40.36332,-3.59496,PAU-Vallecas

40.37517,-3.5781,Berrocales

40.38853,-3.56213,Ahijones

40.33877,-3.67835,Butarque

40.49262,-3.61353,Valdebebas

40.39427,-3.5939,Vicalvaro extension

40.3839,-3.53158,Rivas

40.49239,-3.72772,Arroyo del Fresno

40.45397,-3.90759,Majadahonda

40.50246,-3.51321,Miramadrid-Paracuellos

40.58802,-3.10602,Valdeluz

40.99801,-4.11742,La Encina (Bernuy de Porreros)

40.87828,-4.68457,Villanueva de Gomez. Ávila

38.79932,-4.07395,Villa Mayor de Calatrava. Ciudad Real

38.87209,-3.97485,Pologono Industrial aeropuerto Ciudad Real

39.0472,-3.92153,El Reino de Don Quijote
Once you run the processing script it will automatically generate all the .jpg files based on the locations-latlon.csv. Now it is easy to output different kinds of images with a few tweaks using the style feature of the googlemaps API. If we change the line:
String url = "http://maps.googleapis.com/maps/api/staticmap?center=" + lat + "," + lon + "&zoom=15&scale=1&size=640x640&maptype=satellite&sensor=false&junk=.jpg";
by
String url = "http://maps.googleapis.com/maps/api/staticmap?center=" + lat + "," + lon + "&zoom=15&scale=1&size=640x640&maptype=roadmap&sensor=false&junk=.png";
You’ll have to change also the line to autput a .png file
test.save id + ".jpg");
by
test.save( id + ".png");
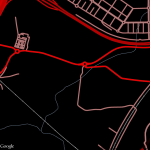
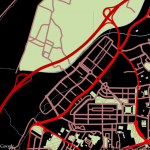
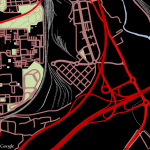
We have now the same tiles, but with the roadmap view. This has been been fun, but we are not using interesting features from the googlemaps API. We can go further, and, by using the element selection, we can adjust colors and visibility. We need to change the line again and add some styling code:
String url = "http://maps.googleapis.com/maps/api/staticmap?center=" + lat + "," + lon + "&zoom=15&scale=1&size=640x640&maptype=roadmap&sensor=false&style=feature:road%7Clement:labels.text

%7Chue:0xff0000%7Csaturation:25%7Clightness:-40&style=feature:landscape%7Celement:geometry

%7Clightness:-100&style=feature:all%7Celement:labels%7Chue:0x0000ff

%7Clightness:-100%7Cvisibility:off&junk=.png";
We are able to decide the color or visibility of every element in the map, in the same way we’d do with http://mapbox.com/ using OpenStreetMap as data provider. We are now ready to start a quiz of PAU (Plan de Actuación Urbanística) recognition. Pending: try the same with OSM data!
–
Thanks Charlie for the link to http://prisonmap.com/
